


Today’s report: Back with the 2022 trend into year end?
Trading conditions will thin out dramatically from this week into the second week of January on account of the holiday break. As things stand, investors haven’t been able to shake that worry around higher inflation and higher interest rates.
Wake-up call
- German Ifo
- PMI beat
- Defense spending
- PMI miss
- Loonie struggles
- risk off
- Inflation headache
- Dealers report
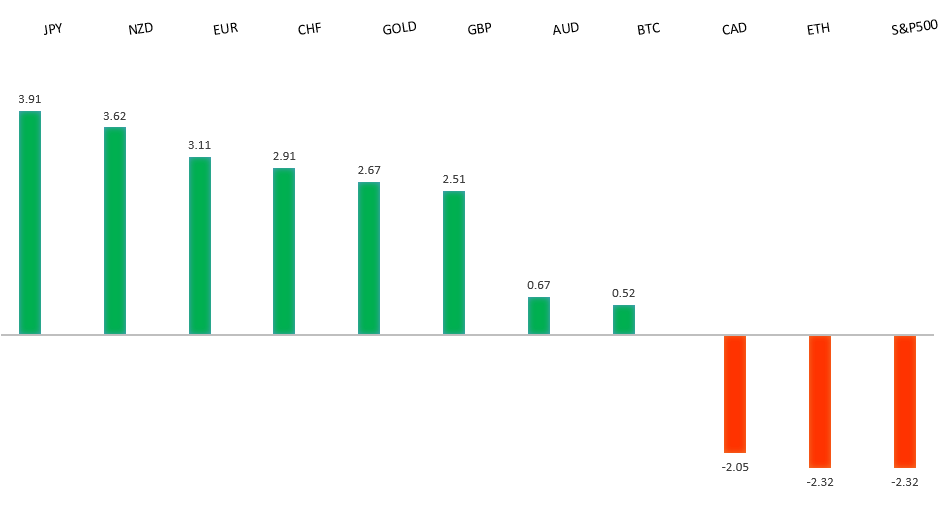
Peformance chart: 30 Day Performance vs. US dollar (%)
Suggested reading
- China’s Covid Reopening Won’t Be Enough to Save Oil Markets, D. Fickling, Bloomberg (December 18, 2022)
- Fractured Markets: The Big Threats to the Financial System, D. Garrahan, Financial Times (December 19, 2022)
Chart talk: Technical & fundamental highlights
Choose pair:
EURUSD – technical overview
The Euro recovery has finally run back above meaningful previous support turned resistance at 1.0635. But we'll need to see a monthly close above this level to suggest the market has established a longer-term base. Inability to hold above 1.0635 on a monthly close basis could open the door for a resumption of declines.EURUSD – fundamental overview
The Euro traded with a heavier tone into the end of last week despite hawkish ECB rhetoric. It seems the market is growing more worried about possible recession risk on the impact of higher rates. Key standouts on Monday’s calendar come from German Ifo reads, Eurozone construction output and wage growth, UK CBI trends, Canada producer prices, and US NAHB housing.EURUSD - Technical charts in detail
GBPUSD – technical overview
Signs have emerged of the market wanting to put in a longer-term base after collapsing to a record low in September. The latest weekly close back above the September high at 1.1739 strengthens this prospect. Any setbacks should now be well supported ahead of 1.1100. Next key resistance comes in at 1.2668.GBPUSD – fundamental overview
The Pound held up relatively well into the end of last week, getting some boost from a surprising UK PMI beat and uptick in consumer confidence. Key standouts on Monday’s calendar come from German Ifo reads, Eurozone construction output and wage growth, UK CBI trends, Canada producer prices, and US NAHB housing.USDJPY – technical overview
Longer-term technical studies are in the process of unwinding from severe overbought readings. Look for additional corrective price action back down towards the 130.00 area before the market considers the possibility of uptrend resumption. Rallies should now be well capped ahead of 140.00.USDJPY – fundamental overview
The Yen saw a fresh wave of demand on improved survey data and a defense spending announcement. Japan composite PMIs rebounded back into expansionary territory. Key standouts on Monday’s calendar come from German Ifo reads, Eurozone construction output and wage growth, UK CBI trends, Canada producer prices, and US NAHB housing.AUDUSD – technical overview
There are signs of the potential formation of a longer-term base following the recent surge back above 0.6500. The latest weekly close back above previous support now turned resistance at 0.6682 strengthens the outlook for a bullish structural shift.AUDUSD – fundamental overview
The Australian Dollar continues to suffer, with a recent Aussie PMI miss and stumbling iron ore prices only adding to the heavier tone. Key standouts on Monday’s calendar come from German Ifo reads, Eurozone construction output and wage growth, UK CBI trends, Canada producer prices, and US NAHB housing.USDCAD – technical overview
A recent surge back above 1.3000 signals an end to a period of bearish consolidation and suggests the market is in the process of carving out a more significant longer-term base. Next key resistance now comes in up into the 1.4000 area. Setbacks should be very well supported down into the 1.3000 area.USDCAD – fundamental overview
Canada economic data has not been impressive of late, while ongoing downside pressure in commodities and risk assets have also weighed on the Canadian Dollar, which put in its lowest close against the Buck in six weeks. Key standouts on Monday’s calendar come from German Ifo reads, Eurozone construction output and wage growth, UK CBI trends, Canada producer prices, and US NAHB housing.NZDUSD – technical overview
Overall pressure remains on the downside with risk for the current recovery rally to stall out and form a lower top for the next major downside extension. A break back above 0.6577 would be required to take the immediate pressure off the downside.NZDUSD – fundamental overview
While the New Zealand Dollar has managed to outperform its commodity currency cousins on account of solid NZ GDP data and a more hawkish outlook for the RBNZ, it has been unable to hold up against the US Dollar, with risk off flow too much to ignore. Key standouts on Monday’s calendar come from German Ifo reads, Eurozone construction output and wage growth, UK CBI trends, Canada producer prices, and US NAHB housing.US SPX 500 – technical overview
Longer-term technical studies are in the process of unwinding from extended readings off record highs. Look for rallies to be well capped in favor of lower tops and lower lows. A monthly close back above 4300 will be required at a minimum to take the immediate pressure off the downside. Next major support comes in at 3492.US SPX 500 – fundamental overview
We've finally reached a point in the cycle where the Fed recognizes unanchored inflation expectations pose a greater downside risk than over-tightening. This is significant, as it means less investor friendly monetary policy that risks potential recession in the months ahead. Overall, we expect inflation to continue to be a problem in Q4 2022 and Q1 2023 that results in downside pressure into rallies.GOLD (SPOT) – technical overview
The 2019 breakout above the 2016 high at 1375 was a significant development, opening the door for fresh record highs. Setbacks should now be well supported above 1600 on a monthly close basis ahead of the next major upside extension. This latest break back above 1808 strengthens the bullish outlook.GOLD (SPOT) – fundamental overview
The yellow metal continues to be well supported on dips with solid demand from medium and longer-term accounts. These players are more concerned about inflation risk and a less upbeat global growth outlook. All of this should keep the commodity well supported, with many market participants also fleeing to the hard asset as the grand dichotomy of record high equities and record low yields comes to an unnerving climax.