


Today’s report: Data light day puts focus on Nvidia earnings
It’s been tough to grasp at any meaningful short-term fundamentals in recent sessions, with most of the market off enjoying the final days of summer. But we did see more reason for the market to be feeling good about Fed rate cuts after taking in some weak US labor data.
Wake-up call
- German data
- PM Starmer
- USDJPY BOJ Himino echoes recent BOJ Ueda comments
- headline CPI
- short squeeze
- USD weakness
- accommodative policy
- Macro themes
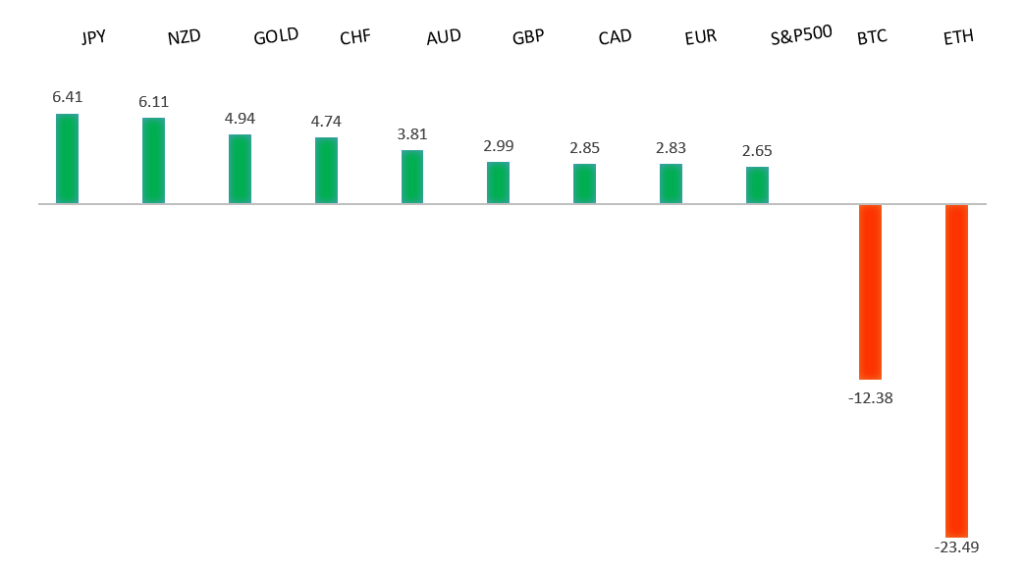
Peformance chart: 30-Day Performance vs. US dollar (%)
Suggested reading
- Edge of Rate Cuts: How We Got Here, B. Ritholtz, The Big Picture (August 26, 2024)
- Stocks Usually Weak Heading Into National Elections, S. McBride, RiskHedge (August 26, 2024)
Chart talk: Technical & fundamental highlights
Choose pair:
EURUSD – technical overview
The Euro has been in a multi-month consolidation since bottoming out in 2022. Setbacks have since been exceptionally well supported on dips below 1.0500, with a higher platform sought out ahead of the next major upside extension. Look for a push through the 2023 high at 1.1276 to strengthen the constructive outlook and extend the recovery run towards 1.2000. Only back below 1.0400 negates.EURUSD – fundamental overview
The Euro hasn't been wanting to extend gains right now, perhaps weighed down by Tuesday's softer German data including consumer confidence reads and discouraging private consumption and capital investment. The only saving grace in the German GDP data came from an upward adjustment to government spending. Absence of first tier data on the Wednesday calendar will leave the focus on Nvidia earnings and bigger picture macro themes.EURUSD - Technical charts in detail
GBPUSD – technical overview
Signs have emerged of the market wanting to put in a longer-term base after collapsing to a record low in September 2022. The door is now open for the next major upside extension towards the 2018 high at 1.4377. Any setbacks should be well supported ahead of 1.2500.GBPUSD – fundamental overview
The Pound has been a clear outperformer in recent sessions as BOE rate cut odds fade. At the same time, the PM has warned of a painful budget, higher taxes, and greater borrowing. On the data front, CBI retail sales went negative for the third month. Absence of first tier data on the Wednesday calendar will leave the focus on Nvidia earnings and bigger picture macro themes.USDJPY – technical overview
The market has entered a period of correction after extending the uptrend to a multi-year high through 160.00. Critical support comes in around 140.00, with only a monthly close below the barrier to compromise the bullish outlook. A higher low is ideally sought out above 140.00 in favor of a bullish continuation.USDJPY – fundamental overview
BOJ Deputy Governor Himino was out on the wires echoing recent comments from BOJ Ueda, hinting the central bank could hike rates further if the economy and prices evolved as projected. Absence of first tier data on the Wednesday calendar will leave the focus on Nvidia earnings and bigger picture macro themes.AUDUSD – technical overview
There are signs of the potential formation of a longer-term base with the market trading down into a meaningful longer-term support zone. Only a monthly close below 0.6200 would give reason for rethink. Back above 0.6900 will take the big picture pressure off the downside and strengthen case for a bottom.AUDUSD – fundamental overview
Aussie headline CPI decelerated by less than expected, with the result translating to a fresh wave of Aussie demand to an eight month high against the US Dollar. Absence of first tier data on the Wednesday calendar will leave the focus on Nvidia earnings and bigger picture macro themes.USDCAD – technical overview
A sustained hold above 1.3000 over the past several months signals an end to a period of longer-term bearish consolidation and suggests the market is in the process of carving out a more significant longer-term base. Next key resistance now comes in up into the 1.4000 area, with a break to open a retest of the 2020 high just ahead of 1.4700. Setbacks should be very well supported down into the 1.3000 area.USDCAD – fundamental overview
The latest run of Canadian Dollar gains seem to be more about stop-hunting than anything else. Fundamentally, the outlook for the Canada economy remains in question, while Tuesday's setbacks in the price of oil and negative wholesale sales print should do nothing to help. Absence of first tier data on the Wednesday calendar will leave the focus on Nvidia earnings and bigger picture macro themes.NZDUSD – technical overview
Overall pressure remains on the downside with the market continuing to stall out on runs up into the 0.6500 area. At the same time, there are some signs of the market wanting to put in a longer-term base. Ultimately, a break back above 0.6500 would be required to take the medium-term pressure off the downside and encourage this prospect. A monthly close below 0.5800 will intensify bearish price action.NZDUSD – fundamental overview
The New Zealand Dollar has been well bid of late on the back of a weaker US Dollar and well supported US equities. Economic data out of New Zealand has been rather neutral of late. Filled jobs contracted in July for a fourth straight month, though the pace of decline fell to its slowest rate over this time period. Absence of first tier data on the Wednesday calendar will leave the focus on Nvidia earnings and bigger picture macro themes.US SPX 500 – technical overview
The longer term uptrend remains intact and dips continue to be exceptionally well supported. Critical support comes in at 5093, with only a break back below this level to compromise the structure and open the door for a more significant corrective decline. Until then, the focus remains on a retest and break back above the record high.US SPX 500 – fundamental overview
The US equities market remains exceptionally well supported in 2024 on the back of an ongoing expectation for more rate cuts than less going forward. Investors are feeling better about a soft landing in the US economy and this has also been accompanied by an accommodative adjustment of Fed policy. It will however be important to keep an eye on inflation, bigger picture economic data and geopolitical risk in the months ahead.GOLD (SPOT) – technical overview
The 2019 breakout above the 2016 high at 1375 was a significant development, opening the door for fresh record highs and this next major upside extension into the 2500-3000 area. Setbacks should now be well supported above 2200 on a monthly close basis.GOLD (SPOT) – fundamental overview
The yellow metal has pushed record highs in 2024 with solid demand from medium and longer-term accounts. These players are more concerned about inflation, geopolitical risk and a less upbeat global growth outlook. All of this should keep the commodity well supported over the coming months.