


 |
|
10 March 2025 Clarity through the chart |
| LMAX Digital performance |
|
Total notional volume from last Monday through Friday came in at $3.5 billion, 5% higher than the week earlier. Breaking it down per coin, bitcoin volume came in at $1.8 billion, 1% lower than the previous week. Ether volume came in at $679 million, 6% higher than the week earlier. Total notional volume over the past 30 days comes in at $14.1 billion. Looking at average position size over the past 30 days, we’re seeing average bitcoin position size at $9,973 and average position size for ether at $1,526. Bitcoin price action has been quite volatile as reflected through peak daily range levels. ETH volatility has been notably calmer of late. We’re looking at average daily ranges in bitcoin and ether of $4,767 and $191 respectively. |
| Latest industry news |
|
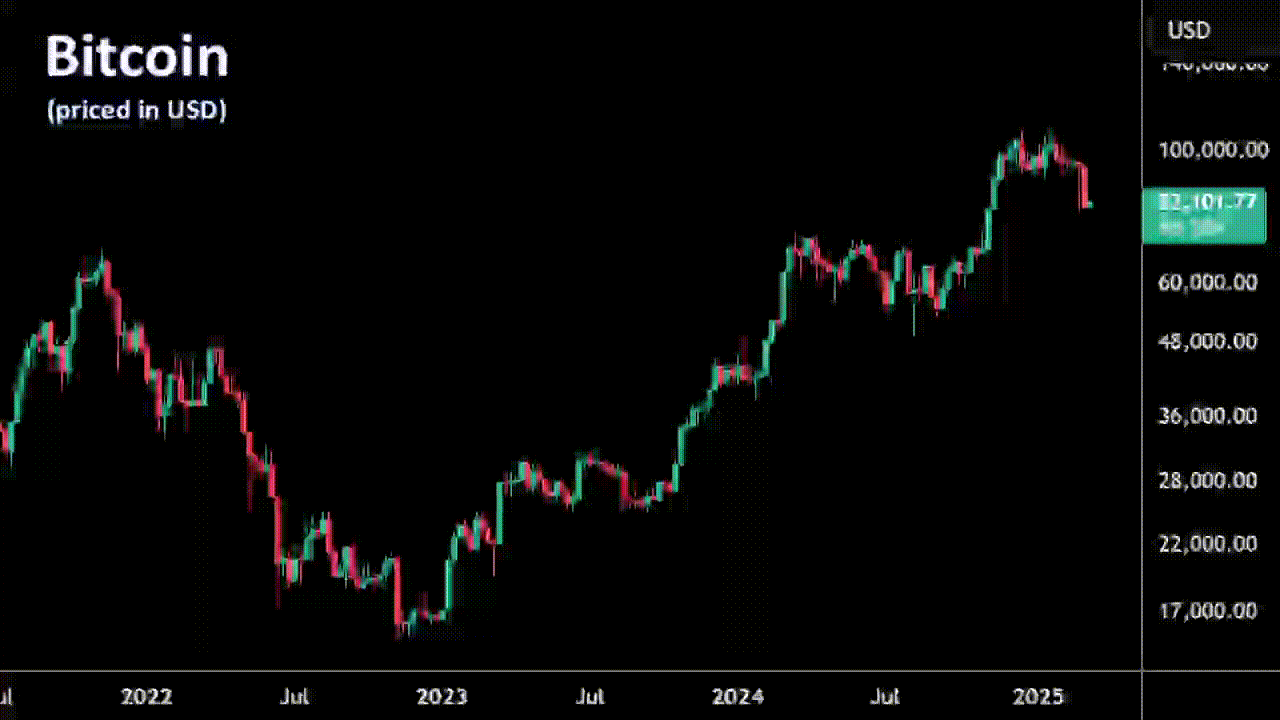
We continue to highlight the significance in appreciating the fact that current crypto market weakness is more about a sell the news effect and overdue technical correction than anything else. Indeed, a vast majority of the news around crypto regulation and adoption has been overwhelmingly positive over the past several months and into 2025. And yet, the market has come under some intense pressure. The global macro outlook could definitely be playing into things, with uncertainty around the outlook for the US economy inspiring a wave of broad based risk off flow that has spilled over into crypto. At the same time, when we look at the bitcoin chart, the picture continues to be a highly constructive one, with the current pullback nothing more than an overdue and healthy retreat to allow for some stretched studies to unwind before resuming the uptrend. We believe the bitcoin chart should be used as a proxy for directional bias within the crypto space and at the moment it looks like bitcoin is getting closer to finding a bottom. As per our technical insights in today’s update, bitcoin should be exceptionally well supported into previous resistance now turned support in the $69-74k area. So while it is still possible we see some more downside, we’re getting closer to the end of the correction, which sets the stage for a healthy recovery in Q2 2025. |
| LMAX Digital metrics | ||||
|
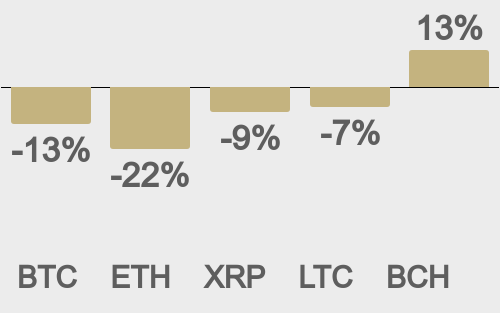
Price performance last 30 days avg. vs USD (%) |
||||
 |
||||
|
Total volumes last 30 days ($bn) |
||||
 |
||||
|
BTCUSD volumes last 30 days ($bn) |
||||
 |
||||
|
BTCUSD avg. trade size last 30 days ($k) |
||||
 |
||||
|
ETHUSD avg. trade size last 30 days ($k) |
||||
 |
||||
| Average daily range | ||||
|
||||

|
||||
|
|
||||
|
@TheBlock__ |
||||
|
@TheBlock__ |
||||
| Crypto Bulletin sign-up | ||||
| Subscribe | ||||