


 |
| 30 June 2025 Things looking up into July |
| LMAX Digital performance |
|
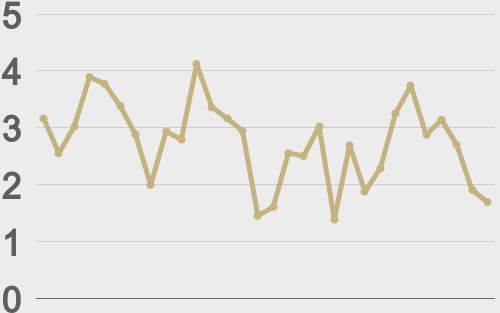
Total notional volume from last Monday through Friday came in at $2.6 billion, 8% higher than the week earlier. Breaking it down per coin, bitcoin volume came in at $1.3 billion, 29% higher than the previous week. Ether volume came in at $597 million, 6% higher than the week earlier. Total notional volume over the past 30 days comes in at $12.5 billion. Looking at average position size over the past 30 days, we’re seeing average bitcoin position size at $11,842 and average position size for ether at $2,832. Bitcoin volatility is still tracking at yearly lows, while ETH volatility is sideways after bottoming in May. We’re looking at average daily ranges in bitcoin and ether of $2,580 and $128 respectively. |
| Latest industry news |
|
We are coming out of a June that played out largely in line with historical expectations. Bitcoin’s performance over the month was flat to modestly positive, consistent with seasonal trends that typically show subdued but stable price action in the lead-up to July. This alignment with historical behavior is reassuring for market participants, particularly as we enter a period that has traditionally delivered stronger returns. July (+7.56% 2013 to present) has often marked the beginning of a more constructive phase for crypto markets, and with the second half of the year historically producing outsized gains, the broader setup remains encouraging. From a policy standpoint, there were notable tailwinds with the advancement of the Genius Act, a proposed bill offering clear federal guidance around stablecoin issuance and custody. While not yet law, the bipartisan momentum behind the act suggests growing institutional and regulatory comfort with tokenized fiat models. Broader regulatory clarity could serve as a key unlock for more conservative players and paves the way for deeper stablecoin integration into payment systems and capital markets infrastructure. On the demand side, flows into U.S.-listed spot Bitcoin and Ethereum ETFs remained net positive despite brief periods of risk-off sentiment in global markets. This steady appetite—even during consolidation phases—points to the resilience of crypto as an emerging asset class and increasing allocation from institutional portfolios. These flows are also helping to anchor price levels and reduce volatility around key technical zones. Meanwhile, corporate treasury demand for Bitcoin continued to expand, with Japan’s Metaplanet adding meaningfully to its BTC reserves in June. This trend is spreading beyond Bitcoin as some early adopters now look to Ethereum as a strategic allocation target. The idea of Ethereum as a yield-generating “tech utility” asset is resonating with forward-looking firms, especially those exploring tokenization strategies on-chain. Technically, the charts are also reinforcing the bullish thesis. Bitcoin’s sharp rebound after briefly dipping below 100k and its move back toward all-time highs suggests strong institutional demand at lower levels and a market that refuses to price in downside risk for long. Ethereum, meanwhile, is showing signs of bullish coiling just below the $2,900 resistance. A clean breakout above this level could trigger the next wave of upside, supported by both improved fundamentals and a more constructive macro backdrop. |
| LMAX Digital metrics | ||||
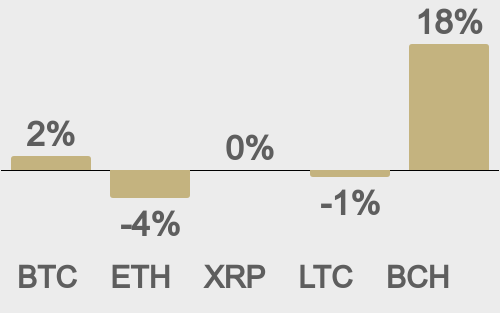
| Price performance last 30 days avg. vs USD (%) |
||||
 |
||||
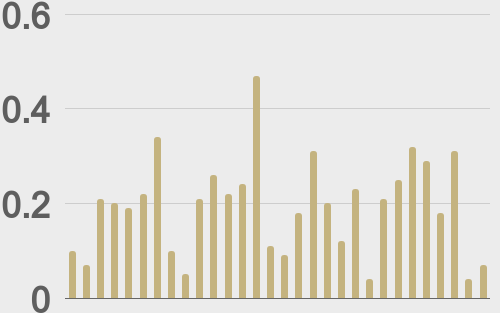
| Total volumes last 30 days ($bn) |
||||
 |
||||
| BTCUSD volumes last 30 days ($bn) |
||||
 |
||||
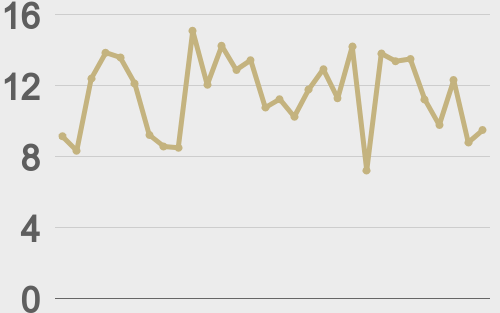
| BTCUSD avg. trade size last 30 days ($k) |
||||
 |
||||
| ETHUSD avg. trade size last 30 days ($k) |
||||
 |
||||
| Average daily range | ||||
|
||||
 |
||||
|
@TheBlock__ |
||||
|
@TheBlock__ |
||||
| Crypto Bulletin sign-up | ||||
| Subscribe | ||||