


 | ||
| 29th June 2025 | view in browser | ||
| Trump’s trade moves shake markets | ||
| The U.S. dollar stabilized into last week’s close, as Treasury yields paused and the S&P 500 hit new year-to-date highs, with markets encouraged by progress in trade deals with the UK, China, and potentially India, alongside possible extensions to the July 9 tariff deadline. | ||
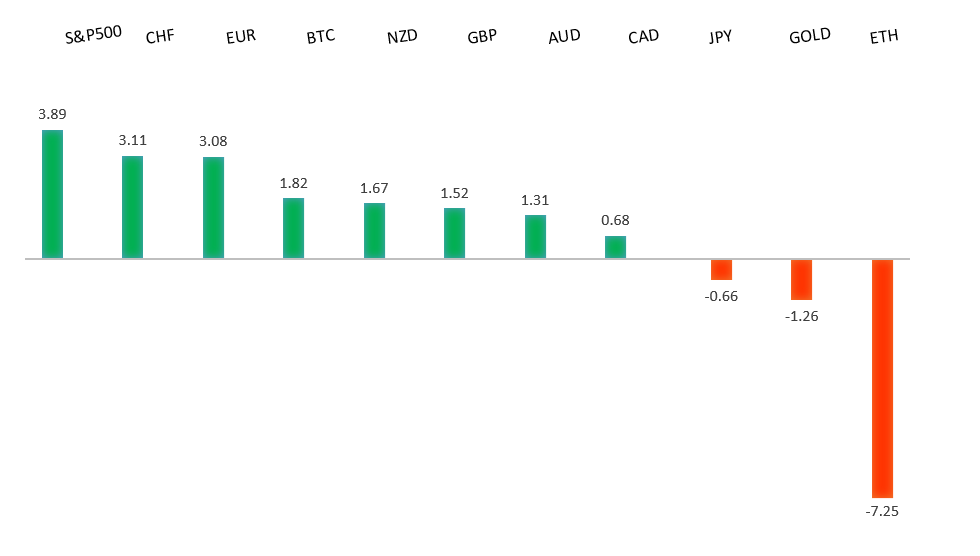
| Performance chart 30day v. USD (%) | ||
 | ||
| Technical & fundamental highlights | ||
| EURUSD: technical overview | ||
| The Euro has finally broken out from a multi-month consolidation off a critical longer-term low. This latest push through the 2023 high lends further support to the case for a meaningful bottom, setting the stage for a bullish structural shift and the next major upside extension targeting the 2021 high at 1.2350. Setbacks should be exceptionally well supported below 1.1000. | ||
 | ||
| R2 1.1800 - Figure - Medium R1 1.1755 - 27 June/2025 high - Medium S1 1.1573 - 24 June low - Medium S2 1.1446 - 19 June low - Strong | ||
| EURUSD: fundamental overview | ||
| The dollar’s ongoing bear market is expected to drive the euro higher, with one major bank predicting it could reach 1.20 to 1.23 by year-end, fueled by faster U.S. interest rate declines compared to other G10 nations. At the ECB’s Sintra forum from June 30 to July 2, central bankers will discuss monetary policy adjustments amid uncertainties tied to Trump’s policies. French Finance Minister Eric Lombard expressed optimism about securing a trade deal with the U.S. before July 9, potentially involving increased European purchases of American LNG. Meanwhile, Ukraine faces escalating Russian missile and drone attacks, with Russia pushing territorial demands and proposing further talks in Istanbul. | ||
| USDJPY: technical overview | ||
| There are signs of a meaningful top in place after the market put in a multi-year high in 2024. At this point, the door is now open for a deeper setback below the 2024 low at 139.58 over the coming weeks, exposing a retest of the 2023 low. Rallies should be well capped below 150.00. | ||
 | ||
| R2 148.65 - 12 May high - Medium R1 148.03 - 23 June high - Medium S1 144.32 - 18 June low - Medium S2 142.79 - 13 June low - Medium | ||
| USDJPY: fundamental overview | ||
| Japan’s Chief Trade Negotiator Akazawa and US Commerce Secretary Lutnick met last Friday but made no significant progress, reaffirming their positions on US tariffs while committing to further talks, with Akazawa extending his US visit. Markets are focused on the upcoming BOJ Tankan Survey, expected to show softened business sentiment due to US 25% tariffs on autos and steel, high food prices, and modest capital expenditure growth for large firms, with potential Yen and Nikkei gains if results exceed expectations. Recent data revealed weaker-than-expected industrial production for May, signaling a fragile economic recovery and ongoing challenges from trade tensions and weak demand, which may keep the BOJ cautious about tightening policy. | ||
| AUDUSD: technical overview | ||
| There are signs of the potential formation of a longer-term base with the market trading down into a meaningful longer-term support zone. Only a monthly close below 0.5500 would give reason for rethink. A monthly close back above 0.7000 will take the big picture pressure off the downside and strengthen case for a bottom. | ||
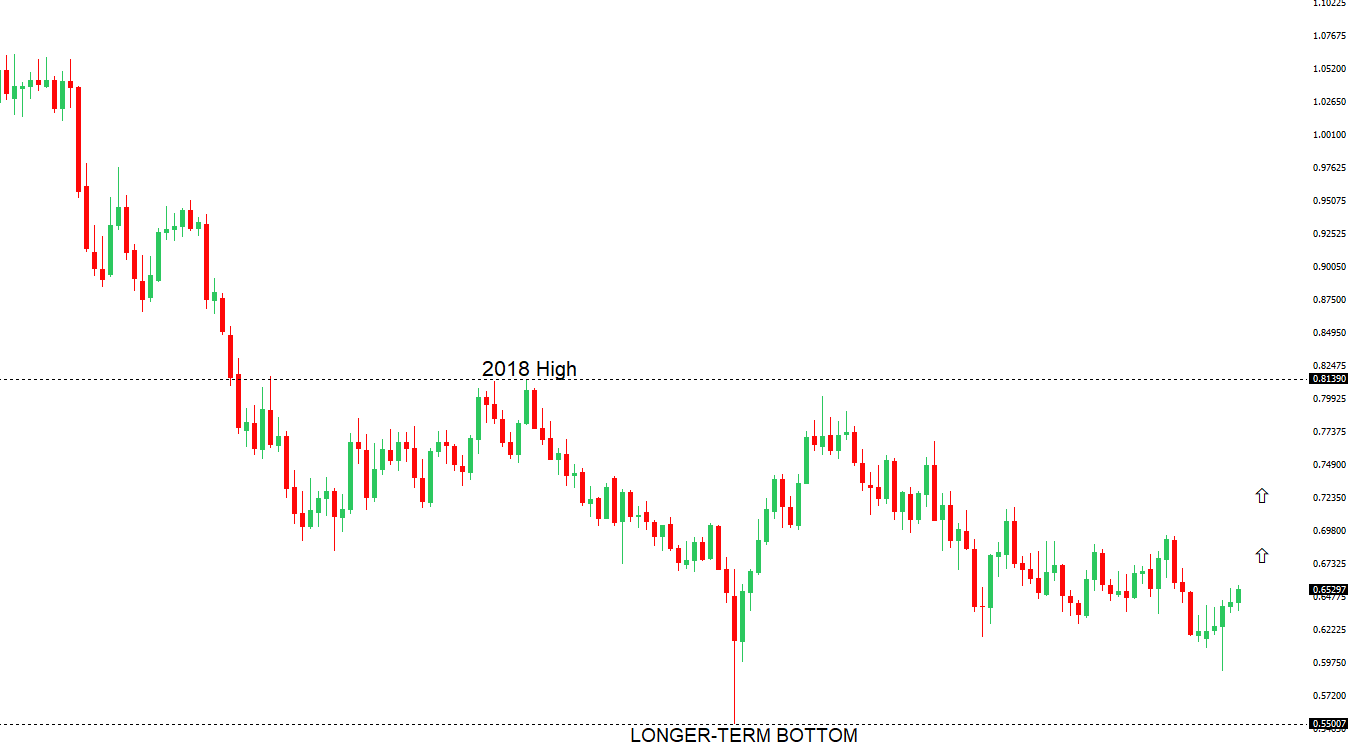 | ||
| R2 0.6600 - Medium - Strong R1 0.6564 - 26 June/2025 high - Medium S1 0.6373 - 23 June low - Medium S1 0.6344 - 24 April low - Strong | ||
| AUDUSD: fundamental overview | ||
| Australia’s commodity export earnings dropped 7% to A$385 billion due to weak iron ore and natural gas prices, despite high gold prices, with further declines expected over the next two years due to trade barriers and slowing global growth. Inflation in May fell to 2.1%, below expectations, prompting economists to predict an earlier Reserve Bank of Australia rate cut in July, with markets anticipating three cuts this year to a terminal rate of around 2.85%-3.10%. The Australian dollar is strengthening against the US dollar, supported by expectations of US Federal Reserve easing, reduced Middle East tensions, and a new US-China trade deal boosting risk currencies. Key upcoming data includes June inflation and May private sector credit figures. | ||
| Suggested reading | ||
| $40 Oil Isn’t Happening , P. Domm, Barrons (June 26, 2025) Passive Investing Is Fueling the Rise of Mega-Firms, L. Swedroe, Morningstar (June 26, 2025) | ||