


 | ||
| 25th May 2026 | view in browser | ||
| Markets lean into Hormuz relief trade amid thin holiday liquidity | ||
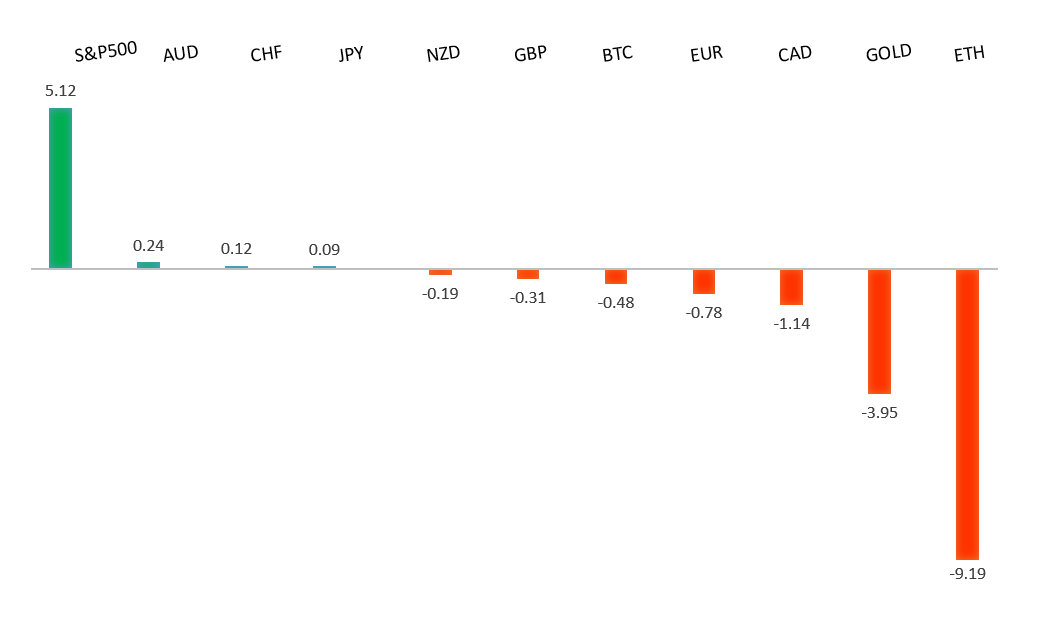
| Markets are starting the week in a thin-liquidity, holiday-shortened relief rally driven by optimism around a potential US-Iran deal easing Hormuz tensions, pushing oil and the dollar lower while lifting global equities, risk FX and broader sentiment despite lingering geopolitical uncertainty. | ||
| Performance chart 30day v. USD (%) | ||
 | ||
| Technical & fundamental highlights | ||
| EURUSD: technical overview | ||
| The Euro outlook remains constructive with higher lows sought out on dips in favor of the next major upside extension targeting the 2021 high at 1.2350. Setbacks should be exceptionally well supported ahead of 1.1300. | ||
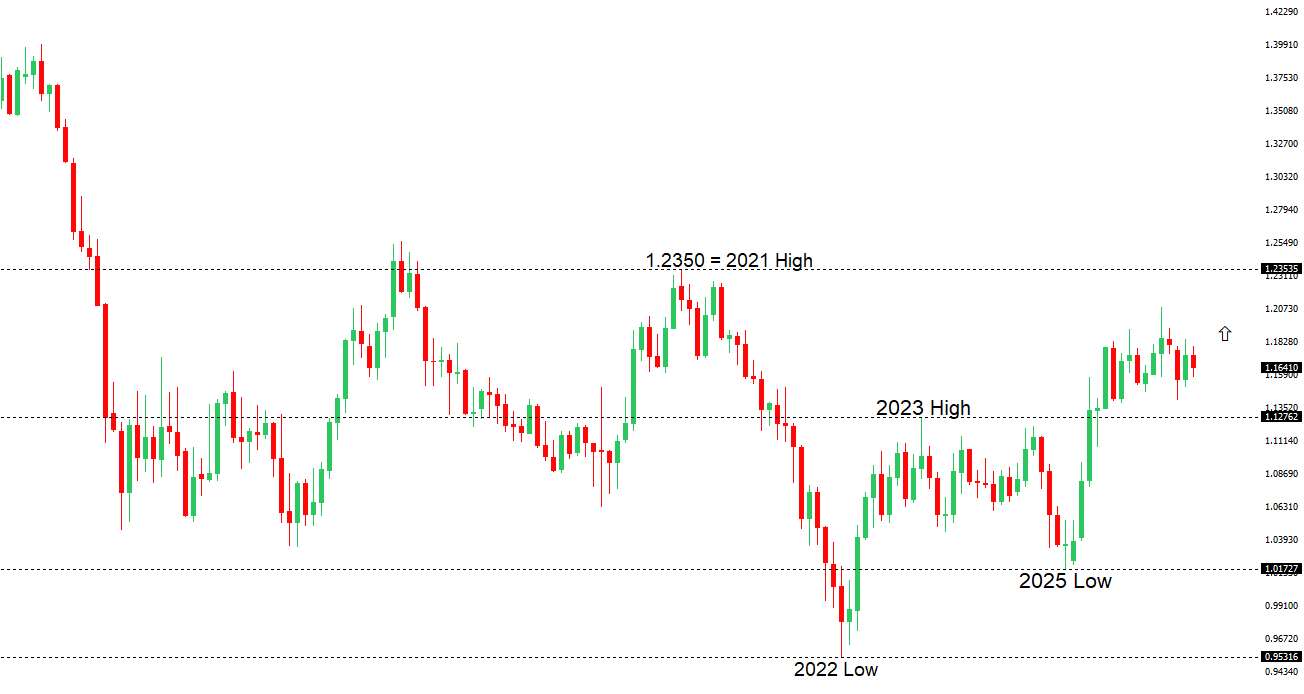 | ||
| R2 1.1797 - 6 May high - Medium R1 1.1722 - 14 May high - Medium S1 1.1576 - 21 May low - Medium S2 1.1504 - 3 April low - Strong | ||
| EURUSD: fundamental overview | ||
| The euro has remained underpinned against the US dollar, with EURUSD holding firm near the mid-1.16s as a combination of softer US dollar sentiment and relatively resilient Eurozone fundamentals continues to support the single currency. A key driver at the start of the week has been improving global risk appetite following comments from US President Donald Trump suggesting a US-Iran agreement is “largely negotiated,” fueling hopes of lower geopolitical tensions and helping trigger a sharp decline in oil prices. The move lower in energy prices has weighed on the dollar by encouraging markets to modestly scale back hawkish Federal Reserve expectations, while broader risk-on flows have further reduced demand for traditional safe havens. At the same time, ECB rhetoric has continued to lean relatively firm, with policymakers increasingly acknowledging the risk of renewed inflation pressures and signaling that the easing cycle may be nearing its end. Comments from ECB officials, including Belgium’s Pierre Wunsch warning that the Eurozone may be at the “beginning of an inflation problem,” have helped reinforce expectations that rates in Europe could remain restrictive for longer than previously assumed. More broadly, narrowing US-Eurozone rate differentials, persistent concerns over the US fiscal outlook, and continued reserve diversification away from the dollar have also contributed to ongoing structural support for the euro. | ||
| USDJPY: technical overview | ||
| There are signs of the formation of a meaningful top after the market put in a multi-year high in 2024. At this point, rallies should be well capped above 160.00 in favor of a fresh down-leg back towards the 2024 low at 139.58. Only a monthly close above 160.00 negates. | ||
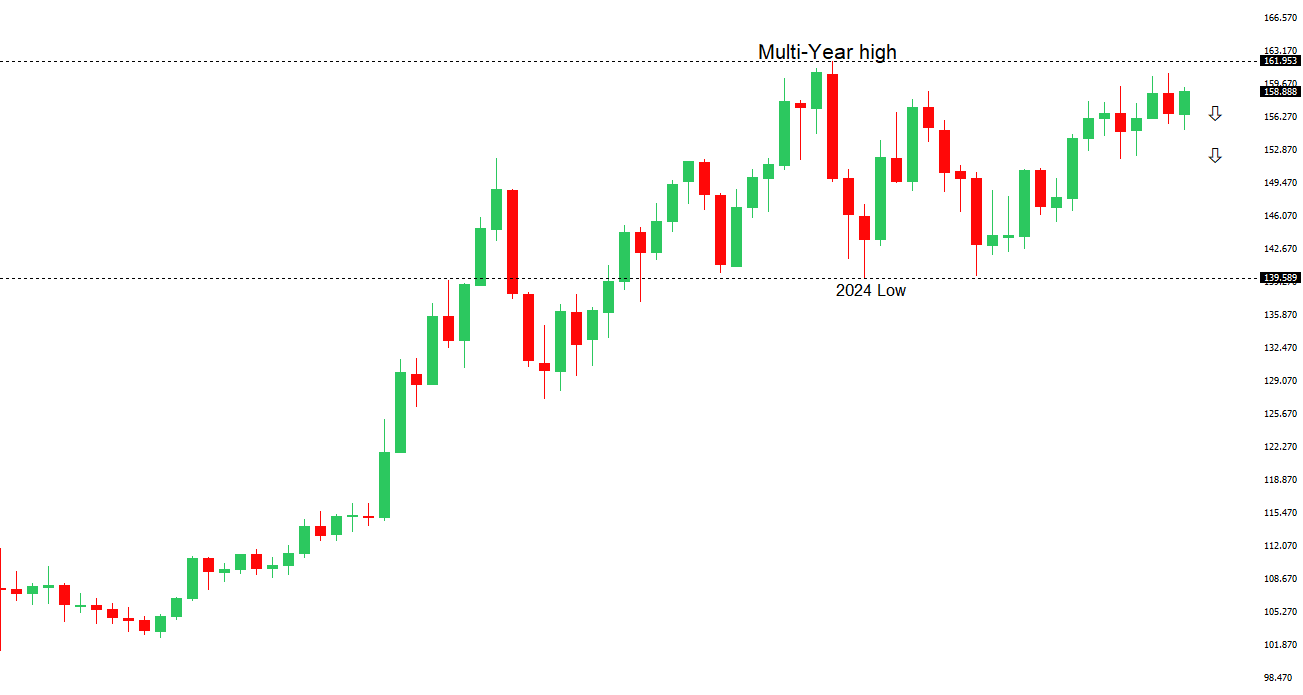 | ||
| R2 159.53 - 17 April low - Medium R1 159.36 - 21 May high - Medium S1 157.29 - 14 May low - Medium S2 155.02 - 6 May low - Strong | ||
| USDJPY: fundamental overview | ||
| The yen has found renewed support in recent sessions, with USDJPY pulling back as easing geopolitical tensions in the Middle East helped drive oil prices lower, improving Japan’s terms of trade given the country’s heavy reliance on imported energy. Reports pointing toward progress on a potential US-Iran agreement and a reopening of the Strait of Hormuz have reduced immediate supply concerns and weighed on the dollar’s safe-haven appeal. At the same time, markets remain highly sensitive to the risk of Japanese official intervention should USDJPY move back toward the 160 level, a threshold that previously triggered action from Tokyo earlier this year. On the domestic side, softer Japanese inflation data has tempered expectations for near-term Bank of Japan tightening, though underlying resilience in the economy and the prospect of gradually rising wages continue to support expectations that the BoJ will maintain a slow normalization path. Meanwhile, the broader dollar outlook remains mixed, as sticky US inflation has led markets to scale back expectations for Fed easing, limiting the extent of yen appreciation despite the recent improvement in risk sentiment. | ||
| AUDUSD: technical overview | ||
| There are signs of the formation of a longer-term base with the market recovering out from a meaningful longer-term support zone. The latest monthly close back above 0.7000 takes the big picture pressure off the downside and strengthens the case for a bottom, with the focus now on a push towards 0.8000. Setbacks should now be well supported ahead of 0.6700. | ||
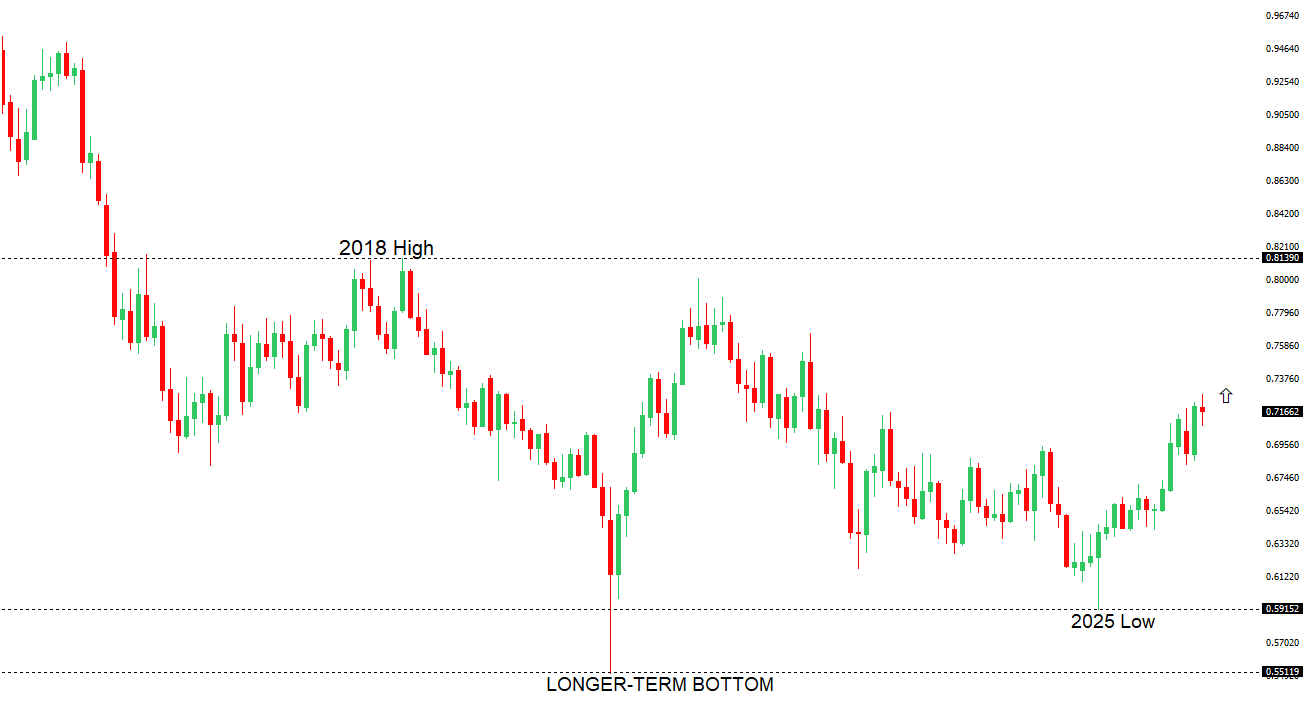 | ||
| R2 0.7300 - Figure - Medium R1 0.7278 - 6 May/2026 high - Medium S1 0.7079 - 19 May low - Medium S2 0.6963 - 8 April low - Strong | ||
| AUDUSD: fundamental overview | ||
| The Australian dollar has been supported at the start of the week by an improvement in broader market risk sentiment, with optimism surrounding a potential US-Iran peace agreement weighing on the safe-haven US dollar and helping AUDUSD recover from last week’s lows. At the same time, the move higher in the Aussie has remained measured as investors continue to balance improving global sentiment against lingering geopolitical uncertainty, particularly around the Strait of Hormuz and Iran’s nuclear program. The currency has also continued to draw underlying support from Australia’s close correlation with global growth expectations and commodity demand, especially from China, though gains have been tempered by expectations that the Federal Reserve could still keep rates elevated for longer if US inflation remains sticky. Overall, the AUD remains caught between improving risk appetite and resilient US yield support, limiting the scope for a more aggressive upside move. | ||
| Suggested reading | ||
| What Are Rising Interest Rates Telling Us?, B. Carlson, AWOCS (May 22, 2026) Real Yields Near 20-Year Highs, J. Picerno, The Capital Spectator (May 20, 2026) | ||