


 | ||
| 17th July 2026 | view in browser | ||
| Dollar firms as markets balance growth and risk | ||
| A resilient US economy, cautious but hawkish Fed messaging, and escalating Middle East tensions are underpinning the dollar heading into Friday, while technology stocks retreat, oil remains supported by geopolitical risk, and markets prepare for another round of key economic data. | ||
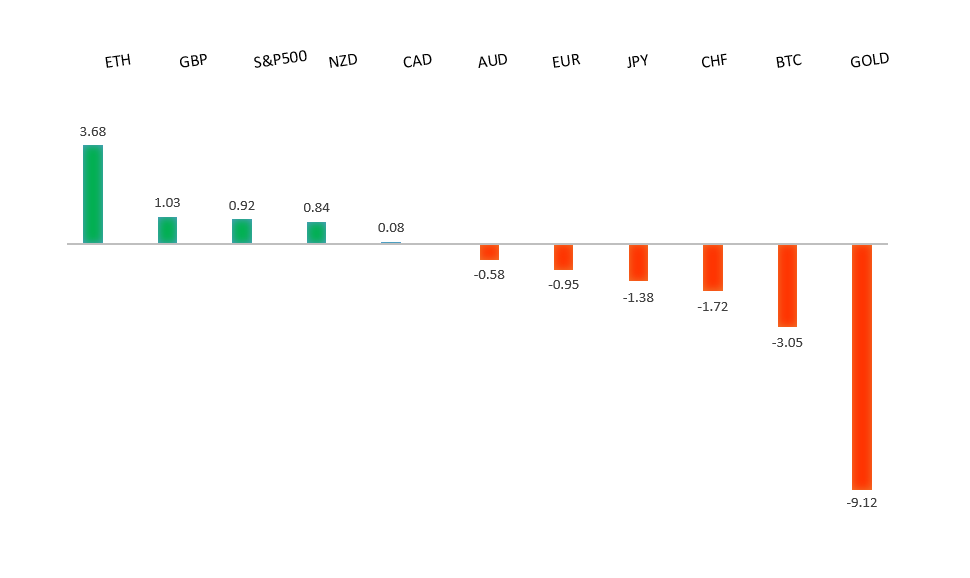
| Performance chart 30day v. USD (%) | ||
 | ||
| Technical & fundamental highlights | ||
| EURUSD: technical overview | ||
| The Euro outlook remains constructive with higher lows sought out on dips in favor of the next major upside extension targeting the 2021 high at 1.2350. Setbacks should be exceptionally well supported ahead of 1.1300. | ||
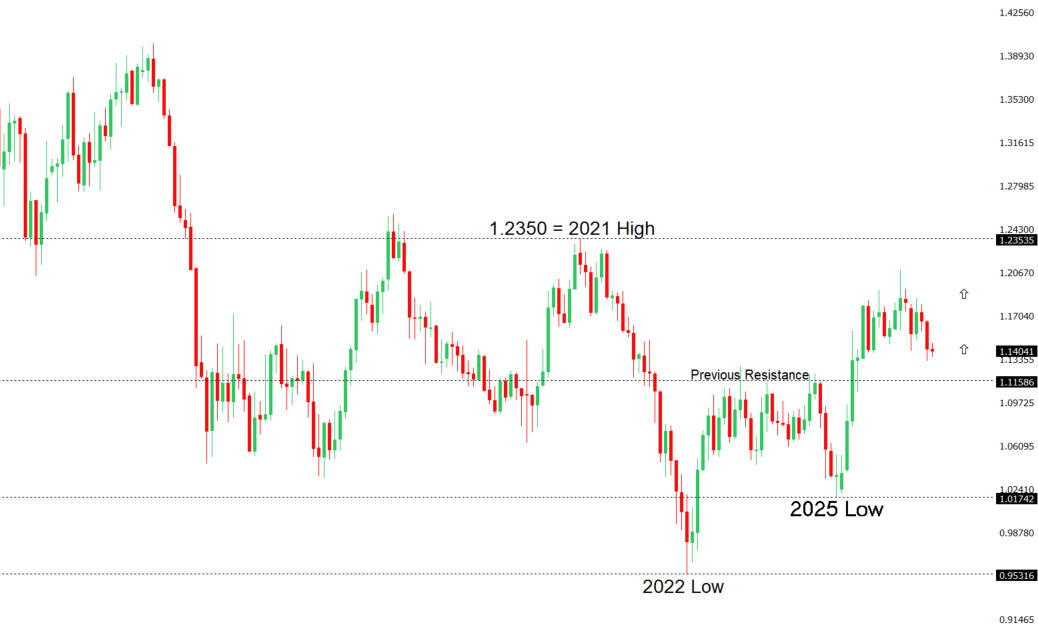 | ||
| R2 1.1529 - 18 June high - Medium R1 1.1483 - 15 July high - Medium S1 1.1325 - 24 June/2026 low - Medium S2 1.1300 - Figure - Medium | ||
| EURUSD: fundamental overview | ||
| The euro has come under modest pressure as the US Dollar stabilises following stronger-than-expected US labour market data, with lower initial jobless claims reinforcing the resilience of the US economy despite softer inflation and helping the greenback recover from recent multi-week lows. Earlier in the week, softer-than-expected US CPI and PPI reports weighed heavily on the dollar by prompting markets to scale back expectations for an immediate Federal Reserve rate hike, offering support to EURUSD. However, that upside has been tempered by renewed geopolitical tensions between the US and Iran, with the escalation in military action and continued disruption around the Strait of Hormuz keeping oil prices elevated and fueling concerns that energy-driven inflation could keep global central banks, including the Fed, cautious about easing policy. On the European side, attention is firmly on the Eurozone’s June inflation report, where any downside surprise in headline or core HICP could reinforce expectations that the ECB is nearing the end of its tightening cycle and limit euro gains. Overall, EURUSD remains caught between a softer Fed outlook that has weakened the dollar and resilient US economic data and geopolitical inflation risks that continue to underpin the greenback and cap further upside in the single currency. | ||
| GBPUSD: technical overview | ||
| The Pound remains exceptionally well supported on dips into the 1.3000 area, with the price largely consolidating above the psychological barrier and previous resistance turned support in the form of the 2023 high. Look for the market to continue be well supported on dips ahead of the next major upside extension through the yearly high at 1.3870 and towards a retest of the 2018 high at 1.4377 further up. Only a monthly close below 1.3000 negates. | ||
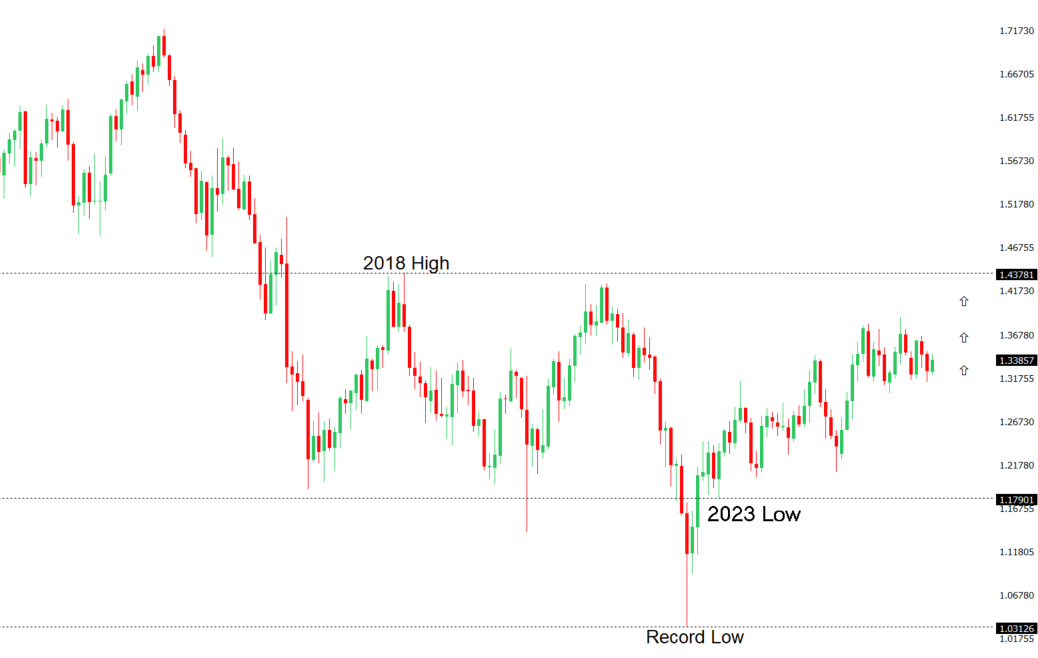 | ||
| R2 1.3658 - 1 May high - Strong R1 1.3558 - 15 July high - Medium S1 1.3452 - 10 July high - Medium S2 1.3322 - 8 July low - Strong | ||
| GBPUSD: fundamental overview | ||
| The Pound has come under modest pressure after a strong July rally as investors digest mixed UK economic data, a slightly more dovish tone from a Bank of England policymaker, and renewed US Dollar strength following resilient US economic releases. While UK GDP showed modest growth in May, weaker-than-expected industrial production highlighted that underlying economic momentum remains uneven, reinforcing expectations that the BoE will remain cautious even as inflation stays above target and elevated energy prices continue to pose upside risks. Political uncertainty has eased following Andy Burnham’s confirmation as the UK’s next Prime Minister, with markets initially welcoming expectations of a relatively centrist and market-friendly government, although attention is now shifting toward his fiscal agenda and whether increased public spending could unsettle gilt markets. Looking ahead, Sterling faces a pivotal week with UK employment, inflation, retail sales and PMI data all due, which will help determine whether the BoE’s hawkish minority gains further support. While the Pound has softened in the near term, the broader recovery from this year’s lows remains intact, with improving political clarity, still-elevated UK inflation and expectations for only gradual BoE easing continuing to provide an underlying fundamental backdrop. | ||
| USDJPY: technical overview | ||
| The major pair has extended its run to fresh multi-decade highs, with the latest push through 160.00 opening the door for further upside towards 165.00-170.00. At the same time, daily studies are looking quite stretched, suggesting we could see a healthy correction on the horizon. A break back below 160.48 would now strengthen the case for a larger pullback. Until then, the market will continue to be focused on additional gains. | ||
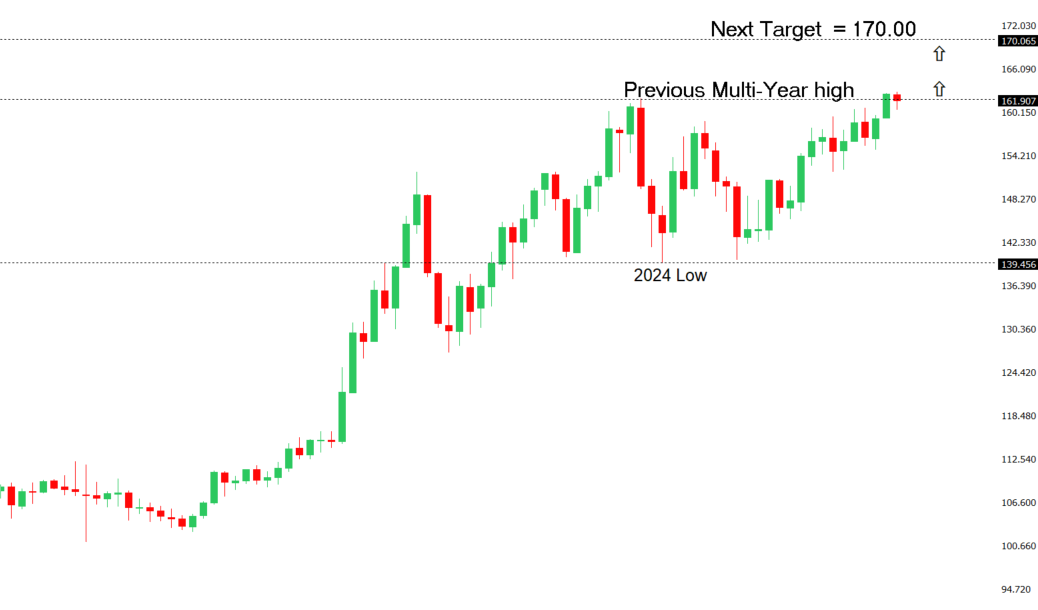 | ||
| R2 163.00 - Figure - Medium R1 162.84 - Multi-Year high/1 July 2026 - Strong S1 161.28 - 10 July low - Medium S2 160.48 - 3 July low - Medium | ||
| USDJPY: fundamental overview | ||
| The Yen remains under pressure as the sharp repricing lower in Federal Reserve rate expectations following softer-than-expected US June CPI has weighed on the US Dollar, but not enough to overcome the Yen’s deep structural headwinds. While Fed Chair Kevin Warsh maintained a hawkish tone by stressing that price stability remains non-negotiable, markets have scaled back expectations for additional Fed tightening, narrowing support for the Dollar. However, the BoJ’s policy rate of just 1.00% still leaves a wide interest rate differential with the US, keeping carry trades firmly in favor of selling the Yen. USDJPY continues to trade just below the key 163.00 level, with intervention fears preventing a clean breakout but repeated official warnings from Tokyo having only a limited impact after this year’s record intervention failed to produce lasting Yen strength. Investors are now focused on next week’s Japanese CPI data for clues on whether inflation is becoming strong enough to justify another BoJ rate hike later this year, while the Fed’s July policy meeting remains equally important. Until there is either a meaningful narrowing in the US-Japan rate gap or a credible shift in BoJ policy, the Yen is likely to remain fundamentally vulnerable despite the ever-present risk of renewed intervention near multi-decade lows. | ||
| AUDUSD: technical overview | ||
| There are signs of the formation of a longer-term base with the market recovering out from a meaningful longer-term support zone. The latest monthly close back above 0.7000 takes the big picture pressure off the downside and strengthens the case for a bottom, with the focus now on a push towards 0.8000. Setbacks should now be well supported ahead of 0.6700. | ||
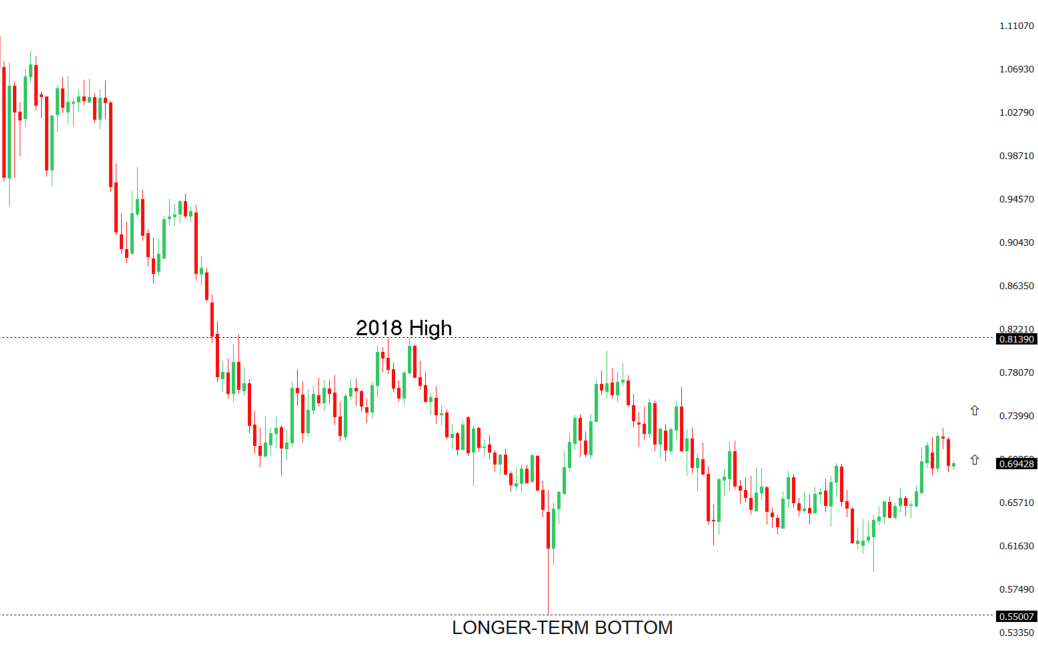 | ||
| R2 0.7089 - 15 June high - Strong R1 0.7022 - 15 July high - Medium S1 0.6912 - 14 July low - Medium S2 0.6865 - 30 June low - Strong | ||
| AUDUSD: fundamental overview | ||
| The Australian dollar remains supported but has lost momentum after its recovery from the 0.6900 area stalled around the key 0.7000 level, as investors reassess the outlook for further Reserve Bank of Australia tightening. A sharp drop in Australian consumer inflation expectations to 4.7% from 5.5% has eased pressure on the RBA to deliver another rate hike in August, reinforcing the view that policymakers can afford to wait for the crucial second-quarter CPI report before making their next move. While the RBA continues to acknowledge persistent underlying inflation and labor cost pressures, softer domestic sentiment and signs of moderating inflation have narrowed expectations for additional tightening. Attention is now shifting toward external drivers, with the Australian dollar continuing to trade primarily as a proxy for China. Markets are closely watching Monday’s People’s Bank of China policy decision for any indication of further stimulus, while ongoing uncertainty surrounding the US-Iran conflict provides mixed effects through higher commodity prices but also stronger safe-haven demand for the US dollar. Meanwhile, resilient US economic data has kept Federal Reserve tightening risks alive, limiting upside for AUDUSD by preventing the Australia-US interest rate differential from moving further in the Aussie’s favor. Next week’s Australian employment report now stands out as the key domestic catalyst, with a stronger, full-time-led jobs print likely to revive RBA hike expectations, while a softer outcome would reinforce the view that rates remain on hold and leave the Australian dollar vulnerable to renewed weakness. | ||
| Suggested reading | ||
| Silicon shadows: inside the black market for AI chips, E. Olcott, Financial Times (July 14, 2026) Oil Shocks Are No Longer So Shocking, N. Roubini, Project Syndicate (July 14, 2026) | ||