


 | ||
| 16th July 2026 | view in browser | ||
| Inflation relief meets geopolitical reality | ||
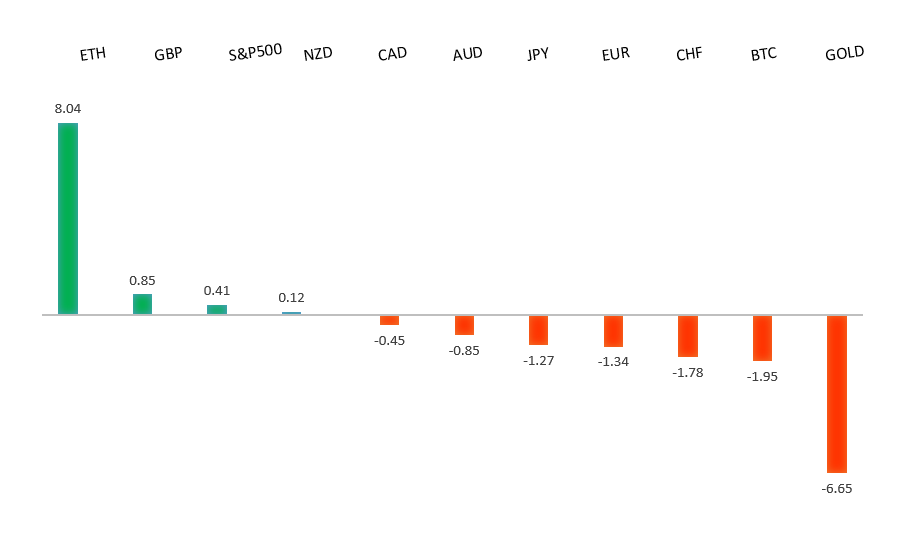
| Softer US inflation continues to pressure the Dollar and support risk sentiment, although investors remain cautious as elevated oil prices and ongoing US-Iran tensions keep geopolitical and inflation risks in focus. | ||
| Performance chart 30day v. USD (%) | ||
 | ||
| Technical & fundamental highlights | ||
| EURUSD: technical overview | ||
| The Euro outlook remains constructive with higher lows sought out on dips in favor of the next major upside extension targeting the 2021 high at 1.2350. Setbacks should be exceptionally well supported ahead of 1.1300. | ||
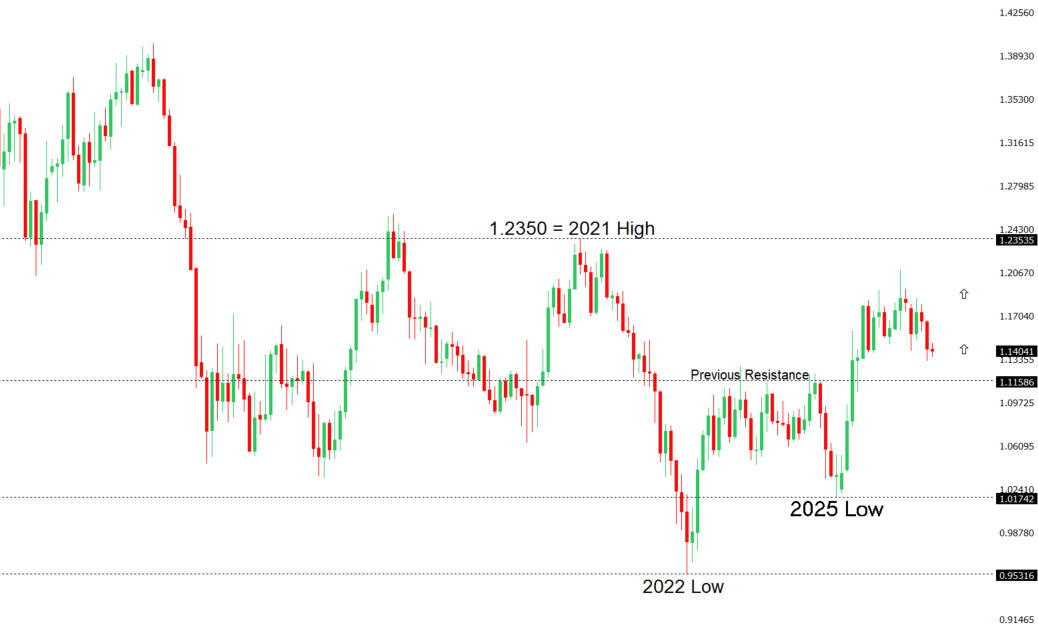 | ||
| R2 1.1529 - 18 June high - Medium R1 1.1483 - 15 July high - Medium S1 1.1325 - 24 June/2026 low - Medium S2 1.1300 - Figure - Medium | ||
| EURUSD: fundamental overview | ||
| The Euro remains supported against the US Dollar, though gains are being driven more by broad Dollar weakness than Eurozone strength. Softer-than-expected US CPI and PPI data have reinforced expectations that the Federal Reserve can afford to remain on hold in the near term, weighing on the Greenback even as Fed Chair Kevin Warsh maintained a broadly hawkish tone by stressing that inflation remains above target and the fight for price stability is not over. On the European side, the macro picture remains mixed after Eurozone industrial production unexpectedly contracted in May, highlighting the region’s sluggish manufacturing sector. However, sticky inflation in Spain, where June HICP held at 3.6% year-over-year, has helped temper expectations for aggressive European Central Bank easing, offering some support to the single currency. That said, escalating tensions in the Middle East, elevated oil prices, and the risk that higher energy costs could reignite global inflation continue to cloud the outlook and are likely to limit the scope for a sustained Euro rally. | ||
| GBPUSD: technical overview | ||
| The Pound remains exceptionally well supported on dips into the 1.3000 area, with the price largely consolidating above the psychological barrier and previous resistance turned support in the form of the 2023 high. Look for the market to continue be well supported on dips ahead of the next major upside extension through the yearly high at 1.3870 and towards a retest of the 2018 high at 1.4377 further up. Only a monthly close below 1.3000 negates. | ||
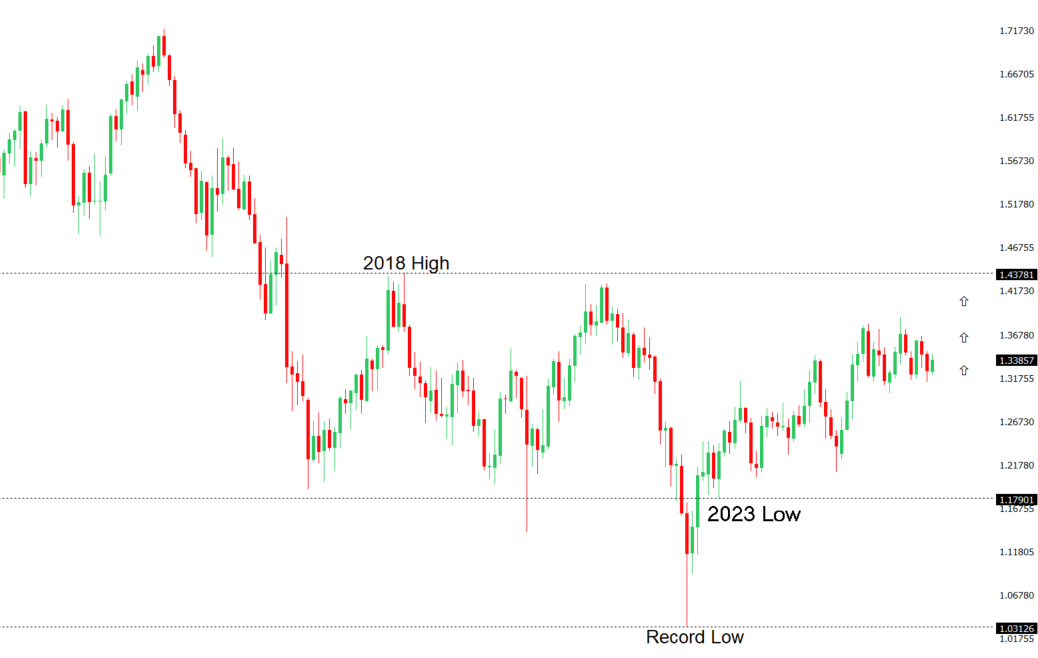 | ||
| R2 1.3658 - 1 May high - Strong R1 1.3558 - 15 July high - Medium S1 1.3452 - 10 July high - Medium S2 1.3322 - 8 July low - Strong | ||
| GBPUSD: fundamental overview | ||
| The Pound has been supported by a combination of broad US Dollar weakness and firm expectations that the Bank of England will need to keep monetary policy restrictive. Softer-than-expected US inflation and producer price data have prompted markets to scale back Federal Reserve tightening expectations, weighing on the Dollar and lifting GBPUSD. At the same time, renewed tensions in the Middle East and higher oil prices have reinforced concerns that inflation could remain sticky in the UK, strengthening expectations for further BoE rate hikes, with a September move fully priced and another increase later in the year still seen as a realistic possibility. Sterling has also drawn modest support from easing political uncertainty ahead of Andy Burnham’s expected transition to prime minister, although markets remain focused on the fiscal direction of the incoming government rather than the leadership change itself. Looking ahead, UK GDP, industrial production and labor market data, followed by next week’s CPI and PMI releases, will be key in determining whether the BoE’s hawkish policy outlook remains intact. | ||
| USDJPY: technical overview | ||
| The major pair has extended its run to fresh multi-decade highs, with the latest push through 160.00 opening the door for further upside towards 165.00-170.00. At the same time, daily studies are looking quite stretched, suggesting we could see a healthy correction on the horizon. A break back below 160.48 would now strengthen the case for a larger pullback. Until then, the market will continue to be focused on additional gains. | ||
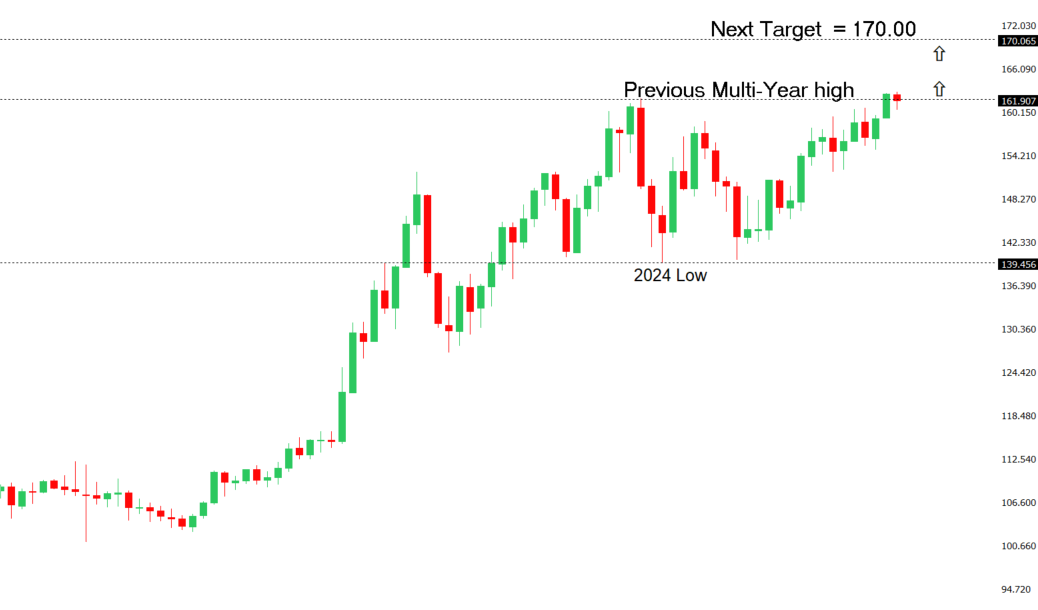 | ||
| R2 163.00 - Figure - Medium R1 162.84 - Multi-Year high/1 July 2026 - Strong S1 161.28 - 10 July low - Medium S2 160.48 - 3 July low - Medium | ||
| USDJPY: fundamental overview | ||
| The Yen remains under pressure despite a softer-than-expected US inflation backdrop, as an initial bout of US Dollar selling following weaker June CPI and PPI data quickly faded in the face of the still-wide US-Japan interest rate differential. Although markets have scaled back expectations for additional Federal Reserve tightening after softer inflation, Fed Chair Kevin Warsh reiterated that price stability remains the Fed’s top priority, helping prevent a deeper repricing of US rate expectations. With the Fed policy rate still sitting well above the Bank of Japan’s 1.00% policy rate, the attractive carry trade continues to weigh heavily on the Yen. At the same time, traders remain cautious about chasing USDJPY higher as intervention risks linger after Japan’s previous currency operations, keeping rallies toward the recent multi-decade highs in check. Investors are also looking ahead to next week’s Japanese trade and CPI data for fresh clues on whether the BoJ can justify another rate hike this year, though inflation remains below the central bank’s 2% target. Meanwhile, renewed US-Iran tensions and elevated oil prices further complicate the outlook by worsening Japan’s energy import bill while supporting safe-haven demand for the US Dollar, leaving the broader bias tilted against the Yen despite periodic bouts of profit-taking in USDJPY. | ||
| AUDUSD: technical overview | ||
| There are signs of the formation of a longer-term base with the market recovering out from a meaningful longer-term support zone. The latest monthly close back above 0.7000 takes the big picture pressure off the downside and strengthens the case for a bottom, with the focus now on a push towards 0.8000. Setbacks should now be well supported ahead of 0.6700. | ||
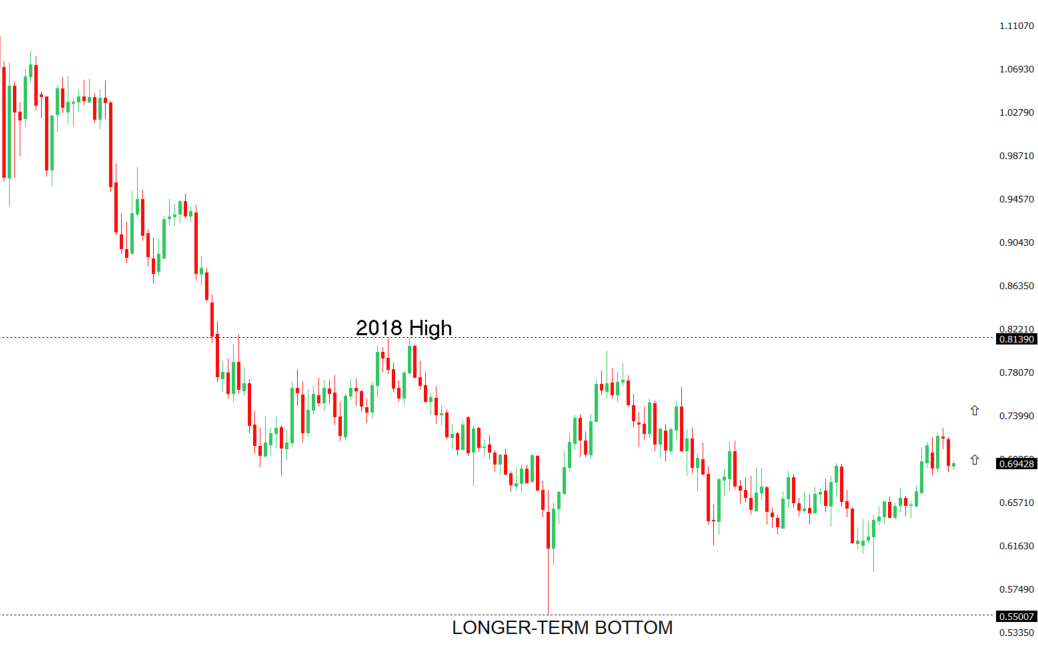 | ||
| R2 0.7089 - 15 June high - Strong R1 0.7022 - 15 July high - Medium S1 0.6912 - 14 July low - Medium S2 0.6865 - 30 June low - Strong | ||
| AUDUSD: fundamental overview | ||
| The Australian Dollar has regained momentum and pushed back above the key 0.7000 level, supported primarily by broad US Dollar weakness after softer-than-expected US CPI and PPI data prompted markets to scale back expectations for further Federal Reserve tightening. While the Greenback has been the dominant driver of recent gains, the Aussie continues to draw underlying support from a relatively resilient domestic backdrop, with the RBA maintaining a cautious but still hawkish bias as policymakers stress that inflation remains too high and that further tightening cannot be ruled out if price pressures persist. Australia’s labor market has remained resilient and business activity has stayed in expansion territory, reinforcing expectations that rates will remain restrictive for some time. Meanwhile, mixed Chinese data has had a broadly neutral-to-supportive impact, with softer Q2 GDP growth offset by stronger industrial production and retail sales, helping ease concerns over demand for Australian exports. Looking ahead, markets will focus on Australian inflation expectations and next week’s employment data for clues on the RBA outlook, while US retail sales, Fed expectations, developments in China, and broader geopolitical risks remain the key external drivers for the Australian Dollar. | ||
| Suggested reading | ||
| How Britain’s first prime minister saved the economy, R. Wigglesworth Financial Times (July 15, 2026) What Insiders Doing Amid Corporate America Buybacks, M. Hulbert, Marketwatch (July 11, 2026) | ||