


 | ||
| 15th July 2026 | view in browser | ||
| Softer inflation print changes the market conversation | ||
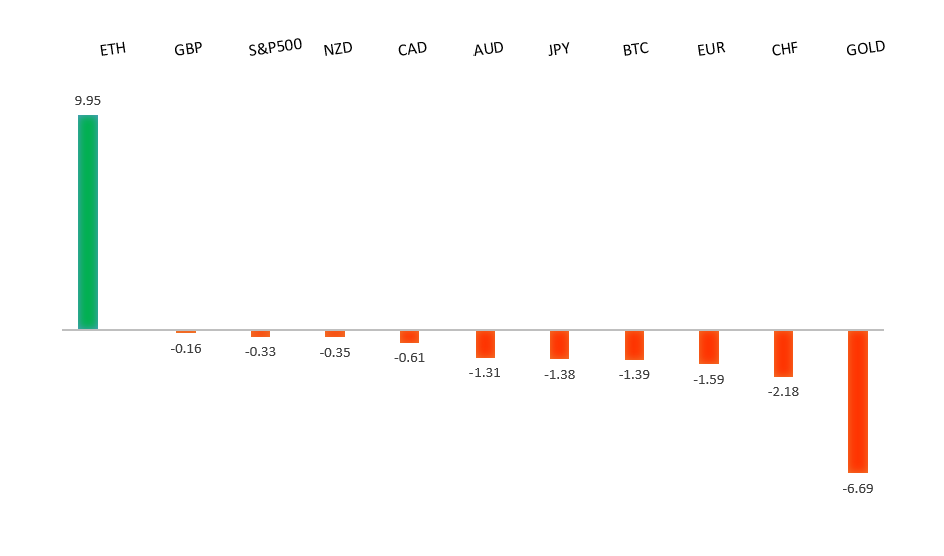
| Softer US inflation has shifted markets into a risk-on stance, weakening the US Dollar and lifting equities, while investors now look to US PPI and Chair Warsh for confirmation that the Fed’s tightening cycle is nearing its end despite ongoing geopolitical risks. | ||
| Performance chart 30day v. USD (%) | ||
 | ||
| Technical & fundamental highlights | ||
| EURUSD: technical overview | ||
| The Euro outlook remains constructive with higher lows sought out on dips in favor of the next major upside extension targeting the 2021 high at 1.2350. Setbacks should be exceptionally well supported ahead of 1.1300. | ||
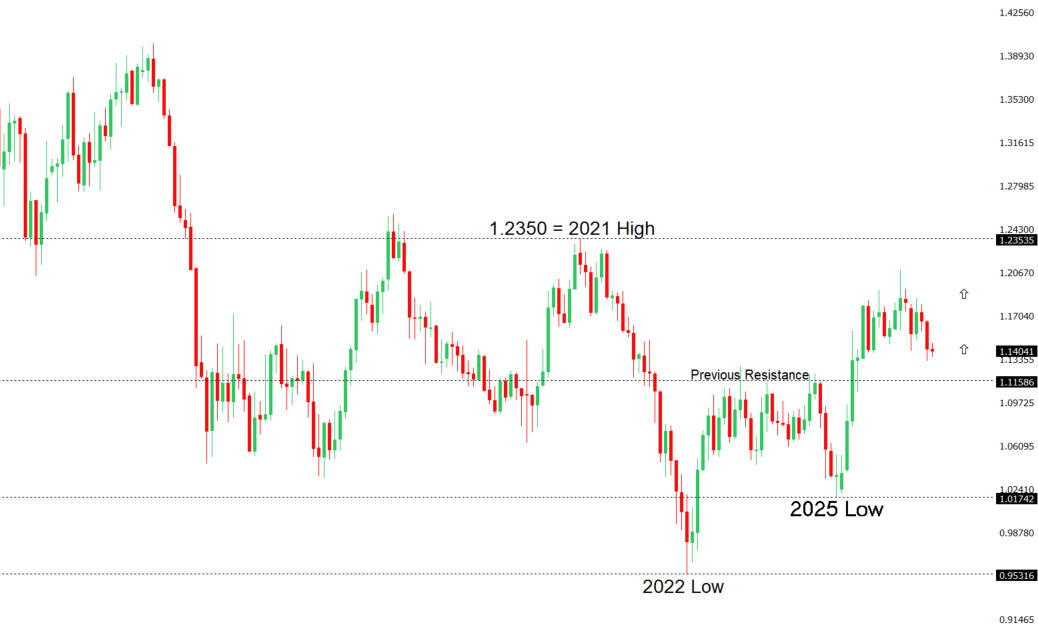 | ||
| R2 1.1529 - 18 June high - Medium R1 1.1473 - 2 July high - Medium S1 1.1325 - 24 June/2026 low - Medium S2 1.1300 - Figure - Medium | ||
| EURUSD: fundamental overview | ||
| The euro is benefiting primarily from broad US Dollar weakness after softer-than-expected US inflation data reinforced expectations that the Federal Reserve will be under less pressure to tighten policy further in the near term. A sharp downside surprise in June CPI, softer core inflation and weaker US employment indicators have weighed on Treasury yields and prompted investors to scale back Fed hike expectations, supporting EURUSD. The single currency is also drawing modest support from the ECB’s relatively hawkish policy stance, with officials continuing to emphasize that inflation risks warrant a restrictive policy setting. Meanwhile, an easing in geopolitical tensions following the revised US-Iran agreement, including a more limited blockade targeting only vessels linked to Iranian ports and the removal of the proposed Strait of Hormuz transit fee, has improved overall risk sentiment and encouraged further US Dollar profit-taking. That said, Fed Chair Kevin Warsh’s still-hawkish rhetoric and lingering expectations for additional Fed tightening later this year continue to limit the euro’s upside, with attention now turning to US PPI for further guidance on the policy outlook. | ||
| GBPUSD: technical overview | ||
| The Pound remains exceptionally well supported on dips into the 1.3000 area, with the price largely consolidating above the psychological barrier and previous resistance turned support in the form of the 2023 high. Look for the market to continue be well supported on dips ahead of the next major upside extension through the yearly high at 1.3870 and towards a retest of the 2018 high at 1.4377 further up. Only a monthly close below 1.3000 negates. | ||
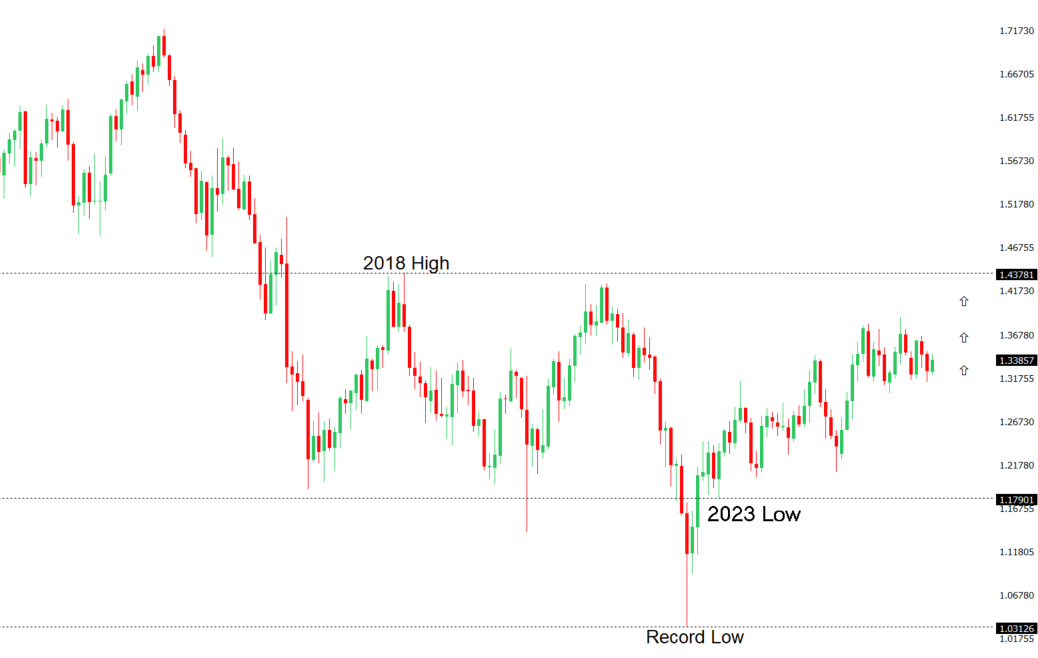 | ||
| R2 1.3461 - 15 June high - Medium R1 1.3452 - 10 July high - Medium S1 1.3322 - 8 July low - Medium S2 1.3273 - 22 June high - Medium | ||
| GBPUSD: fundamental overview | ||
| The Pound has been supported by a weaker US Dollar after softer-than-expected US inflation prompted markets to scale back expectations for further Federal Reserve tightening, although those gains have faded as Fed Chair Kevin Warsh reiterated that one benign inflation report is insufficient to declare victory over inflation and left the door open to further policy tightening if price pressures persist. Sterling continues to draw underlying support from expectations that the incoming Andrew Burnham government will broadly adhere to existing fiscal rules, easing concerns over a significant shift in UK fiscal policy, while the Bank of England’s relatively hawkish stance, with policymakers maintaining that inflation risks remain elevated and further tightening cannot be ruled out, also underpins the currency. However, renewed geopolitical tensions in the Middle East, higher oil prices, and the prospect of sticky inflation on both sides of the Atlantic have tempered risk appetite and prevented a more sustained move higher. Investors are now turning their attention to upcoming UK GDP and industrial production data for fresh clues on the strength of the domestic economy, with stronger-than-expected growth likely to reinforce expectations that the BoE will keep policy restrictive for longer, while broader direction for GBPUSD will continue to hinge largely on incoming US data and evolving Fed expectations. | ||
| USDJPY: technical overview | ||
| The major pair has extended its run to fresh multi-decade highs, with the latest push through 160.00 opening the door for further upside towards 165.00-170.00. At the same time, daily studies are looking quite stretched, suggesting we could see a healthy correction on the horizon. A break back below 160.48 would now strengthen the case for a larger pullback. Until then, the market will continue to be focused on additional gains. | ||
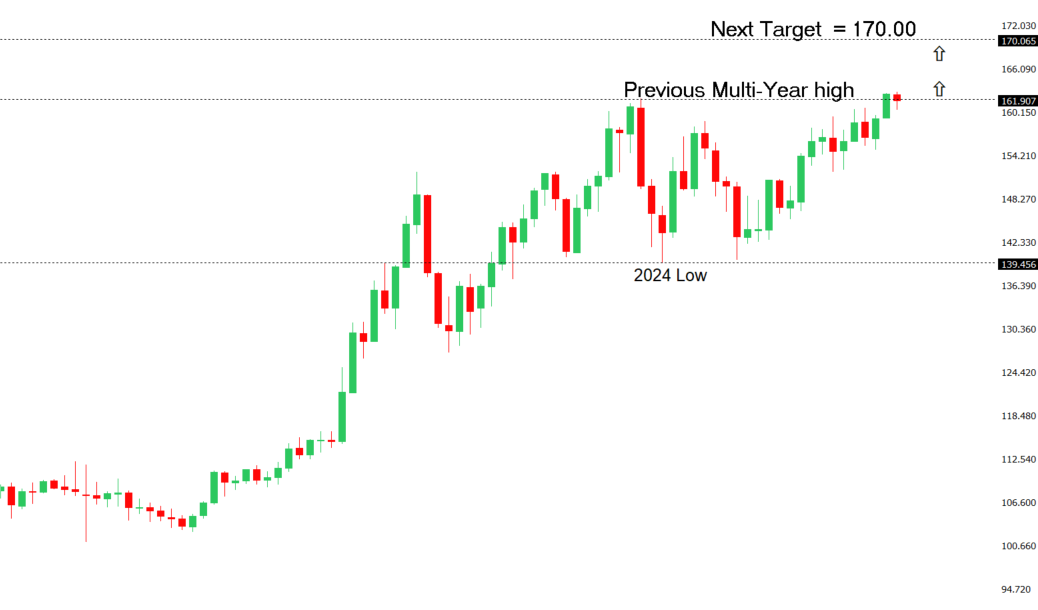 | ||
| R2 163.00 - Figure - Medium R1 162.84 - Multi-Year high/1 July 2026 - Strong S1 161.28 - 10 July low - Medium S2 160.48 - 3 July low - Medium | ||
| USDJPY: fundamental overview | ||
| The Yen has found some support after softer-than-expected US inflation prompted markets to scale back Federal Reserve tightening expectations, weighing on the US Dollar and narrowing, at least modestly, the policy divergence that has pressured the JPY for much of the year. Fed Chair Kevin Warsh maintained a cautious tone, stressing that one benign inflation report does not signal victory over inflation, leaving markets focused on upcoming US PPI data and further Fed commentary for confirmation of the policy outlook. Domestically, however, the Yen’s broader fundamentals remain fragile, with the Bank of Japan still maintaining a far more accommodative policy stance than most major central banks, preserving a wide US-Japan yield differential that continues to encourage carry trades. Meanwhile, elevated oil prices driven by ongoing US-Iran tensions and disruption to shipping through the Strait of Hormuz remain an additional headwind for energy-importing Japan by worsening its terms of trade, although persistent concerns over possible Japanese government currency intervention continue to discourage traders from aggressively extending USDJPY gains after the pair’s recent push to multi-decade highs. | ||
| AUDUSD: technical overview | ||
| There are signs of the formation of a longer-term base with the market recovering out from a meaningful longer-term support zone. The latest monthly close back above 0.7000 takes the big picture pressure off the downside and strengthens the case for a bottom, with the focus now on a push towards 0.8000. Setbacks should now be well supported ahead of 0.6700. | ||
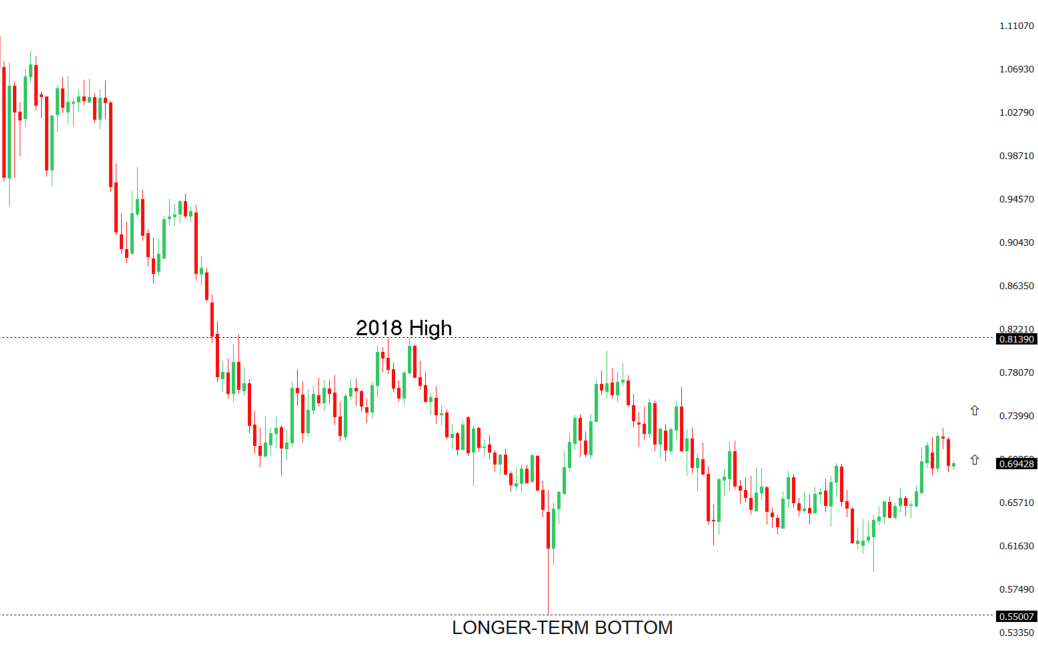 | ||
| R2 0.7089 - 15 June high - Strong R1 0.6993 - 14 July high - Medium S1 0.6865 - 30 June low - Medium S2 0.6833 - 30 March low - Strong | ||
| AUDUSD: fundamental overview | ||
| The Australian dollar has regained momentum, climbing back toward the 0.7000 level as softer-than-expected US June CPI data triggered broad US Dollar selling and prompted markets to scale back expectations for further Federal Reserve tightening. While the weaker greenback has been the dominant catalyst, domestic fundamentals continue to provide an underlying source of support. The Reserve Bank of Australia remains firmly data dependent and has maintained a mildly hawkish bias, stressing that inflation remains too high and that further tightening cannot be ruled out if price pressures prove more persistent. Australia’s labor market continues to show resilience, while business activity has remained in expansionary territory, reinforcing the view that the economy is outperforming many of its G10 peers despite softer GDP growth and a recent deterioration in the trade balance. Externally, China’s economy has stabilized rather than reaccelerated, offering a steady but less powerful backdrop for Australia’s export sector, with stronger trade data offset by still-subdued domestic demand. Looking ahead, the Australian dollar is likely to remain primarily driven by US Dollar dynamics, global risk sentiment and incoming Chinese economic data, while the RBA’s relatively restrictive policy stance should continue to provide support on periods of weakness. | ||
| Suggested reading | ||
| Silicon shadows: inside the black market for AI chips, E. Olcott, Financial Times (July 14, 2026) “I, AI,” Am Just a Toddler: Imagine Me When I’m An Adult, D. Steinhart, RiskHedge (July 13, 2026) | ||