


 | ||
| 7th August 2026 | view in browser | ||
| Markets brace for jobs data as geopolitical risk returns | ||
| Markets turn more defensive into Friday as renewed Middle East tensions lift oil and safe-haven demand, the US Dollar finds support from higher yields and hawkish Fed signals, and investors await the US jobs report for the next major catalyst. | ||
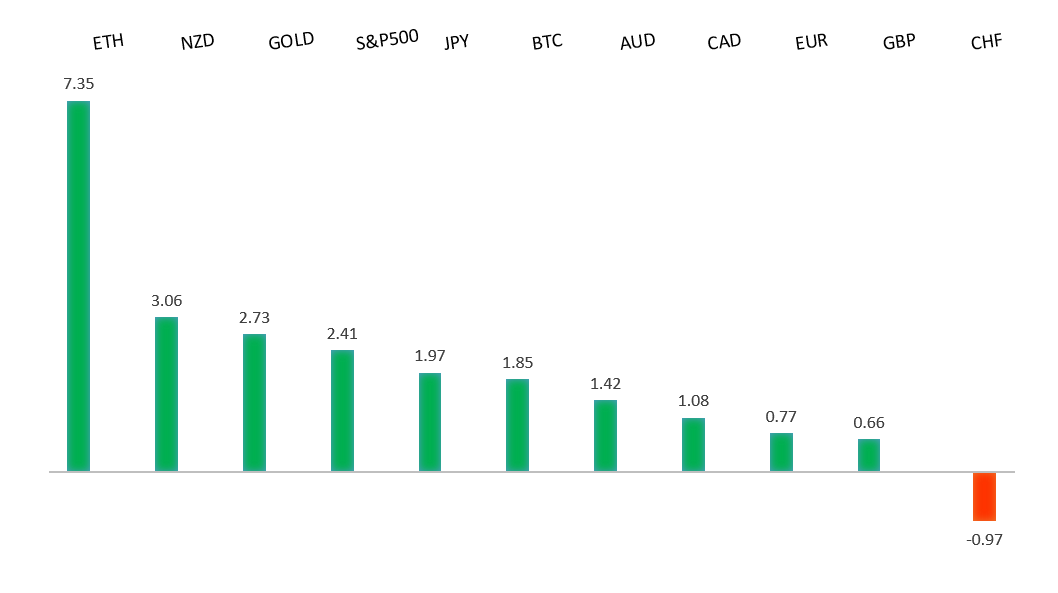
| Performance chart 30day v. USD (%) | ||
 | ||
| Technical & fundamental highlights | ||
| EURUSD: technical overview | ||
| The Euro outlook remains constructive with higher lows sought out on dips in favor of the next major upside extension targeting the 2021 high at 1.2350. Setbacks should be exceptionally well supported ahead of 1.1300. | ||
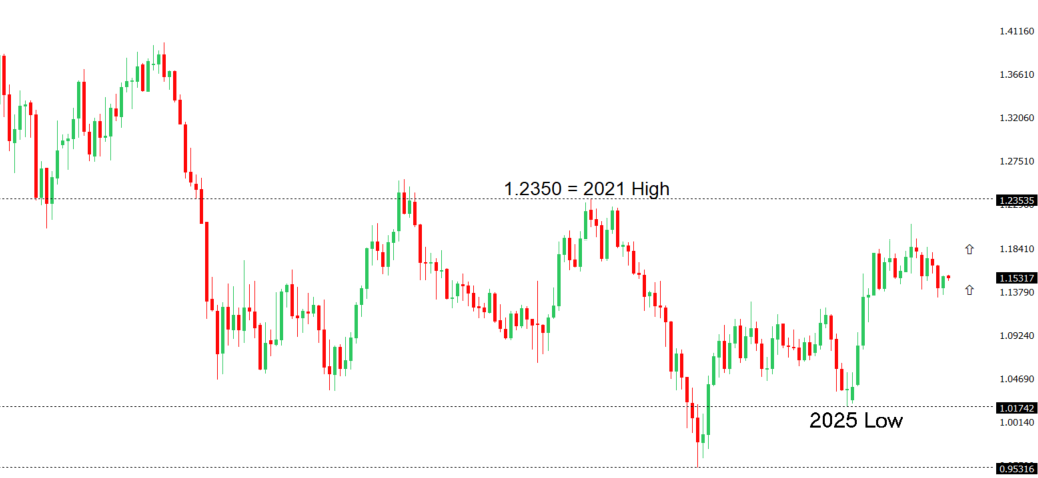 | ||
| R2 1.1623 - 15 June high - Medium R1 1.1600 - Figure - Medium S1 1.1500 - Figure - Medium S2 1.1434 - 30 July low - Medium | ||
| EURUSD: fundamental overview | ||
| The Euro has come back under some pressure into the end of the week, with EURUSD retreating toward the 1.1520 area as renewed tensions around the Strait of Hormuz revive safe-haven demand for the US Dollar. The rebound in oil prices and US Treasury yields has also worked against the single currency, with higher energy costs threatening to complicate the inflation outlook on both sides of the Atlantic and reinforcing expectations that central banks may need to maintain restrictive policy for longer. On the domestic front, the latest Eurozone data have been less encouraging, with June retail sales unexpectedly falling 0.3% month-on-month and annual growth slowing to just 0.7%, highlighting continued weakness in household demand. Meanwhile, the ECB remains firmly data dependent after leaving rates unchanged at its latest meeting, with policymakers continuing to flag geopolitical and energy-price risks as potential sources of renewed inflation pressure. Overall, the Euro remains caught between a relatively cautious ECB and soft regional growth on one side, and shifting expectations around US monetary policy and geopolitical risk on the other, leaving today’s US employment report as the next major catalyst for EURUSD direction. | ||
| GBPUSD: technical overview | ||
| The Pound remains exceptionally well supported on dips into the 1.3000 area, with the price largely consolidating above the psychological barrier and previous resistance turned support in the form of the 2023 high. Look for the market to continue be well supported on dips ahead of the next major upside extension through the yearly high at 1.3870 and towards a retest of the 2018 high at 1.4377 further up. Only a monthly close below 1.3000 negates. | ||
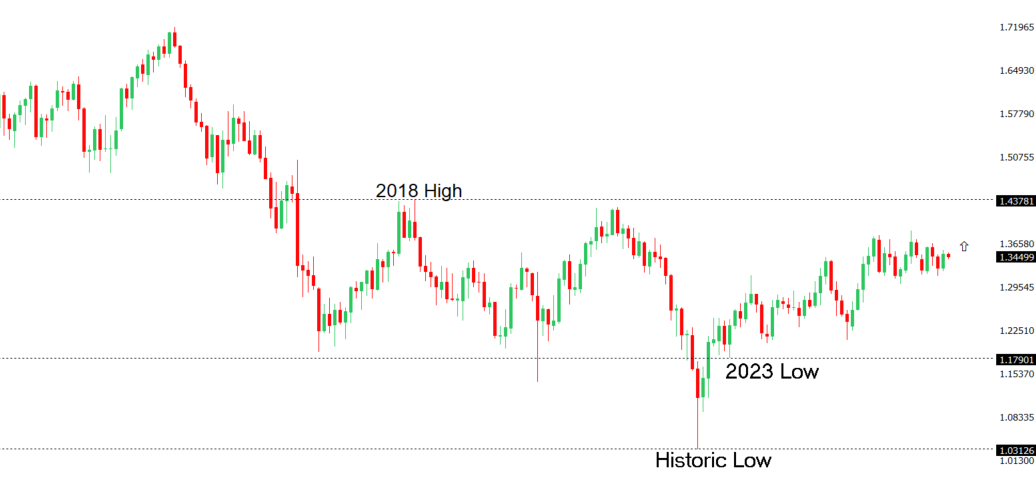 | ||
| R2 1.3558 - 15 July high - Strong R1 1.3507 - 3 August high - Medium S1 1.3333 - 30 July low - Medium S2 1.3273 - 28 July low - Strong | ||
| GBPUSD: fundamental overview | ||
| The Pound has come under renewed pressure, with GBPUSD slipping back toward 1.3450 as narrowing UK-US yield differentials and a firmer US Dollar outweigh an improvement in UK political sentiment. Sterling’s domestic backdrop remains complicated by the combination of higher oil prices and softer growth concerns, which raises the risk of more persistent inflation while presenting the Bank of England with an increasingly difficult policy trade-off. This follows last week’s BoE meeting, where Governor Andrew Bailey maintained that the disinflation process remains on track and played down the need for additional tightening, limiting support from UK rate expectations. At the same time, fading concerns surrounding the recent UK political transition and the new government’s emphasis on fiscal responsibility have provided some underlying support for the Pound. Externally, however, renewed tensions surrounding the Strait of Hormuz have revived safe-haven demand for the US Dollar, while higher energy prices and hawkish Fed rhetoric have reinforced concerns that US rates could remain elevated. Attention now turns to today’s US employment report, which could prove an important catalyst for GBPUSD through its impact on Fed expectations, Treasury yields and the broader direction of the Dollar. | ||
| USDJPY: technical overview | ||
| The major pair has entered a period of correction and consolidation after extending its run to fresh multi-decade highs at 163.99. Setbacks are now expected to be well supported above 155.00, with only a break below to compromise the bullish structure. | ||
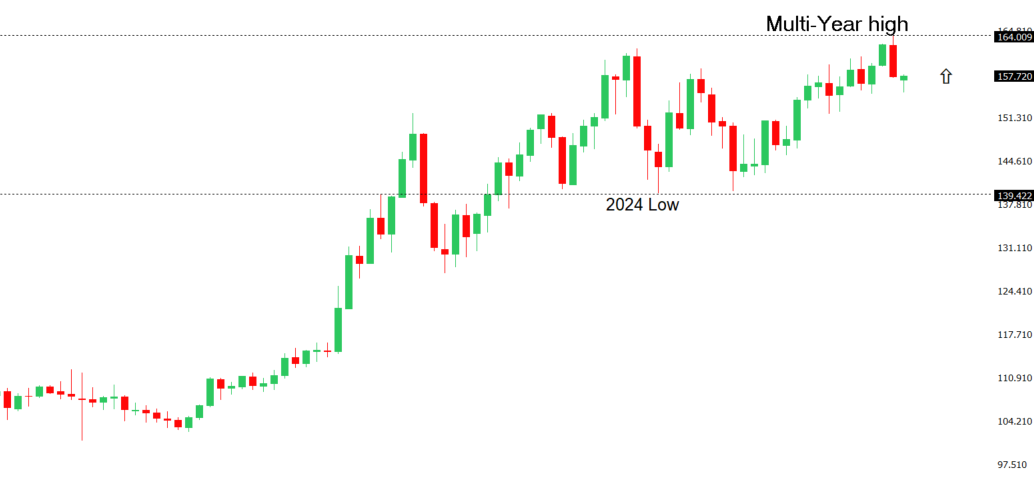 | ||
| R2 160.00 - Psychological - Strong R1 159.00 - Figure - Medium S1 157.00 - Figure - Medium S2 155.02 - 6 May low - Strong | ||
| USDJPY: fundamental overview | ||
| The Yen remains under pressure, with USDJPY consolidating around the mid-158.00s after rebounding from the 155.20 area reached following the recent joint US-Japan intervention. The latest domestic data have reinforced the Yen’s underlying challenges, with household spending unexpectedly falling 3.3% year-on-year in June, marking a seventh consecutive decline and raising doubts over whether the Bank of Japan will be in a position to deliver another rate hike as soon as September. Fiscal concerns and the vulnerability of Japan’s economy to elevated energy prices are adding to the pressure, while the wide US-Japan yield differential continues to favor the Dollar. At the same time, lingering Middle East uncertainty and renewed inflation concerns have supported US Treasury yields and the Greenback, further limiting the Yen’s ability to build on its intervention-driven gains. The broader picture therefore remains one in which official intervention can provide meaningful short-term support for the Yen, but a more sustained reversal will likely require a shift in the underlying fundamentals, particularly a firmer BoJ tightening path or a meaningful decline in US yields. Attention now turns to the US jobs report, which could prove important for USDJPY by reshaping expectations around the Fed and the direction of US yields. | ||
| AUDUSD: technical overview | ||
| There are signs of the formation of a longer-term base with the market recovering out from a meaningful longer-term support zone. The latest monthly close back above 0.7000 takes the big picture pressure off the downside and strengthens the case for a bottom, with the focus now on a push towards 0.8000. Setbacks should now be well supported ahead of 0.6700. | ||
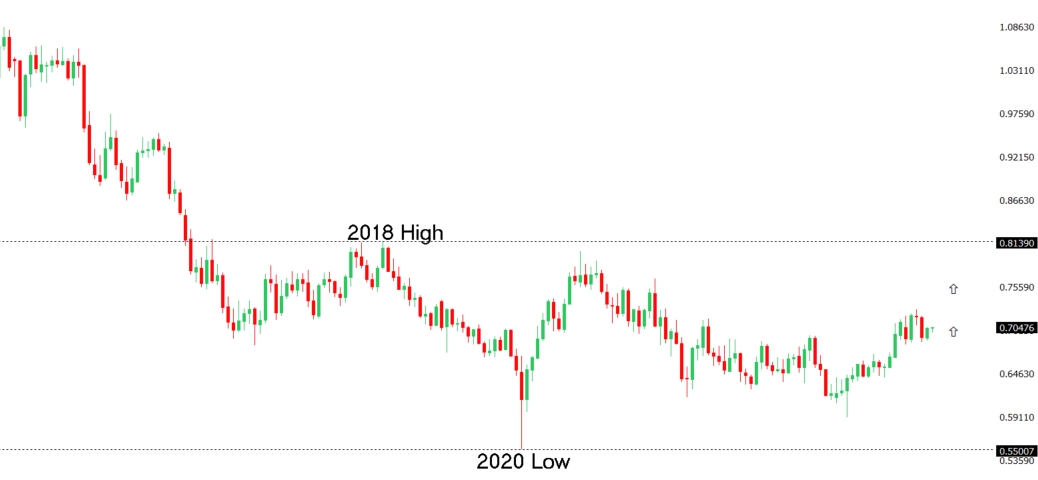 | ||
| R2 0.7089 - 15 June high - Strong R1 0.7065 - 5 August high - Medium S1 0.6922 - 29 July low - Medium S2 0.6865 - 30 June low - Strong | ||
| AUDUSD: fundamental overview | ||
| The Australian Dollar has lost some momentum into the end of the week, with AUDUSD slipping back from the 0.7050 area as renewed tensions around the Strait of Hormuz have revived safe-haven demand for the US Dollar and pushed oil prices and US yields higher. The domestic backdrop remains comparatively supportive: Australia’s labour market is resilient, July PMIs showed a notable improvement in activity, and inflation remains sufficiently sticky to keep the RBA cautious, even though softer recent inflation readings have reduced the urgency for another hike. Attention now turns to the RBA’s August 11 meeting, with markets largely expecting rates to remain unchanged but still leaving some risk of additional tightening later in the year. China remains a mixed influence: July exports rose a strong 23.9% year-on-year and imports 27.5%, but both slowed from June and the trade surplus narrowed to $112.5 billion, reinforcing the view that China is stabilizing rather than providing a powerful new tailwind for the Aussie. For now, the AUD therefore retains a modestly constructive underlying fundamental profile, but near-term direction is being dictated more by global risk sentiment, oil and the US Dollar, with today’s US jobs report the next major catalyst for whether AUDUSD can make another sustained push through 0.7000 or comes under renewed pressure. | ||
| Suggested reading | ||
| What Yen Rescue May Have To Do With the Rally, J. Rennison, The New York Times (August 5, 2026) Reports of the 60/40 Portfolio’s Demise Are Premature, M. Hulbert, Marketwatch (August 5, 2026) | ||