


 | ||
| 16th October 2026 | view in browser | ||
| Between the data and the doubt | ||
| Global markets head into the new day balancing persistent inflation pressures against falling bond yields, a softer dollar and growing scrutiny of the artificial intelligence trade. | ||
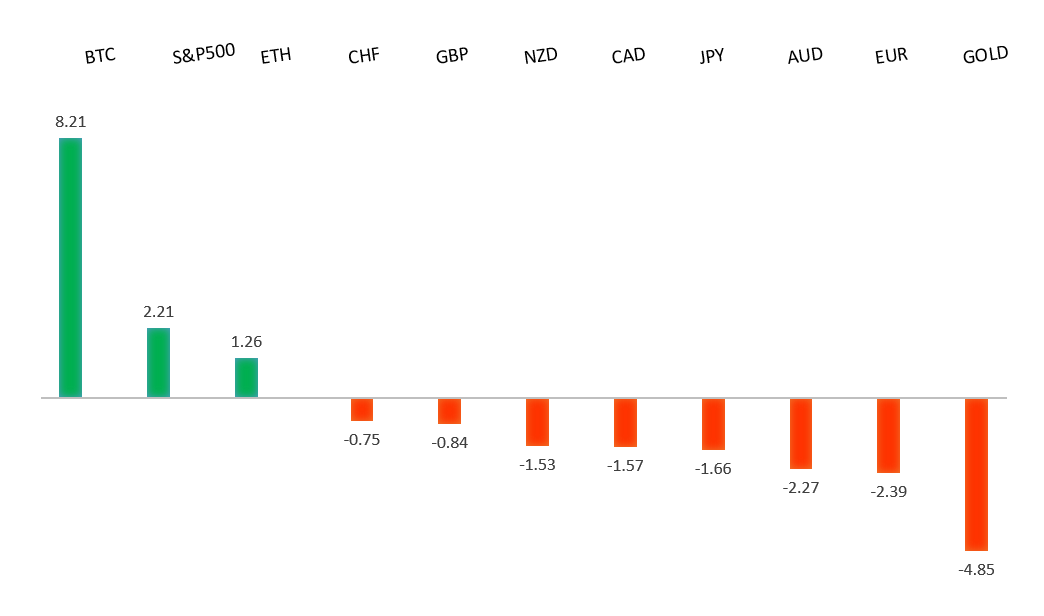
| Performance chart 30day v. USD (%) | ||
 | ||
| Technical & fundamental highlights | ||
| EURUSD: technical overview | ||
| The Euro outlook remains constructive despite recent setbacks with higher lows sought out on dips in favor of the next major upside extension targeting the 2021 high at 1.2350. Setbacks should be exceptionally well supported ahead of 1.1000. | ||
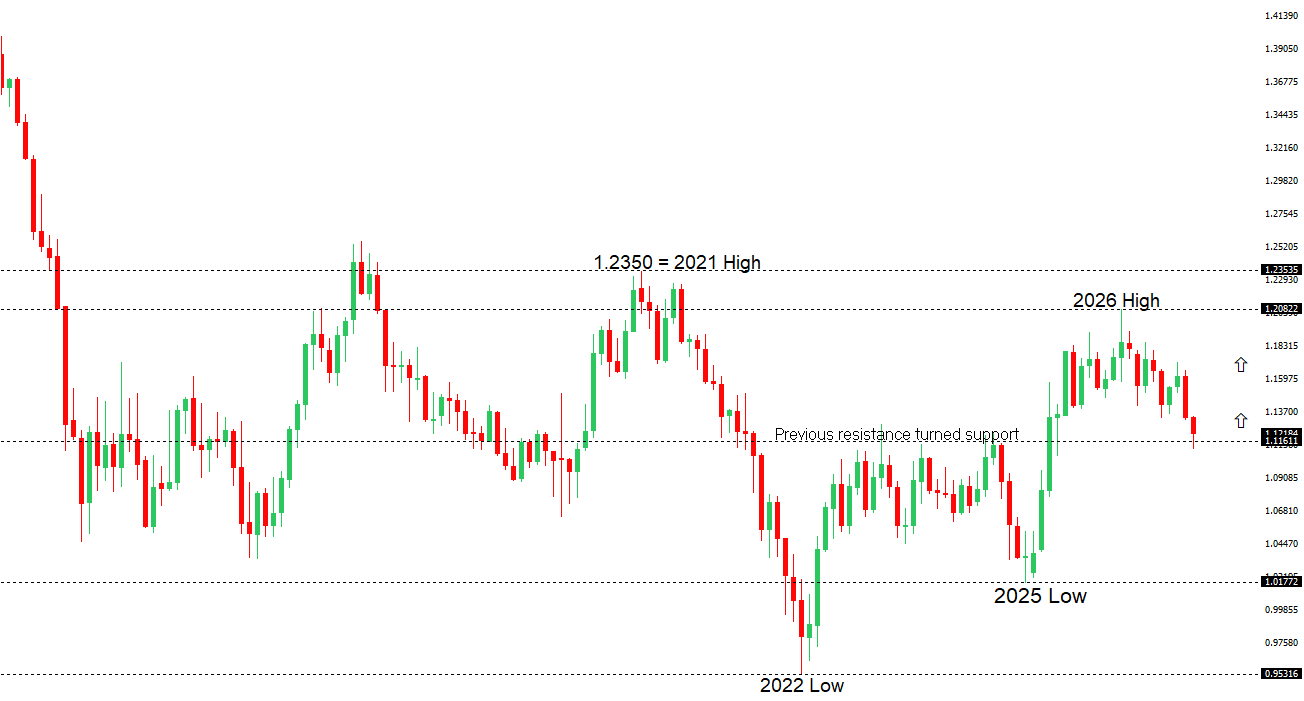 | ||
| R2 1.1337 - 1 October high - Medium R1 1.1286 - 2 October high - Medium S1 1.1148 - 15 October low - Medium S2 1.1113 - 14 October/2026 low - Strong | ||
| EURUSD: fundamental overview | ||
| The euro has held up above 1.1200 following its recovery, showing resilience despite hotter US inflation readings and renewed expectations for further Fed tightening. The dollar’s inability to sustain its initial post-inflation gains, alongside the subsequent decline in US Treasury yields, suggests considerable hawkishness may already be priced in, offering the single currency some support. France’s fiscal challenges and ongoing Middle East tensions remain headwinds, but these concerns have so far failed to undermine the recovery. Attention now turns to Fed Chair Warsh’s remarks for guidance on the policy outlook, with the euro’s resilience suggesting further upside is possible if his comments fail to materially strengthen the case for higher US rates. | ||
| GBPUSD: technical overview | ||
| The Pound remains exceptionally well supported on dips into the 1.3000 area, with the price largely consolidating above the psychological barrier and previous resistance turned support in the form of the 2023 high. Look for the market to continue be well supported on dips ahead of the next major upside extension through the yearly high at 1.3870 and towards a retest of the 2018 high at 1.4377 further up. Only a monthly close below 1.3000 negates. | ||
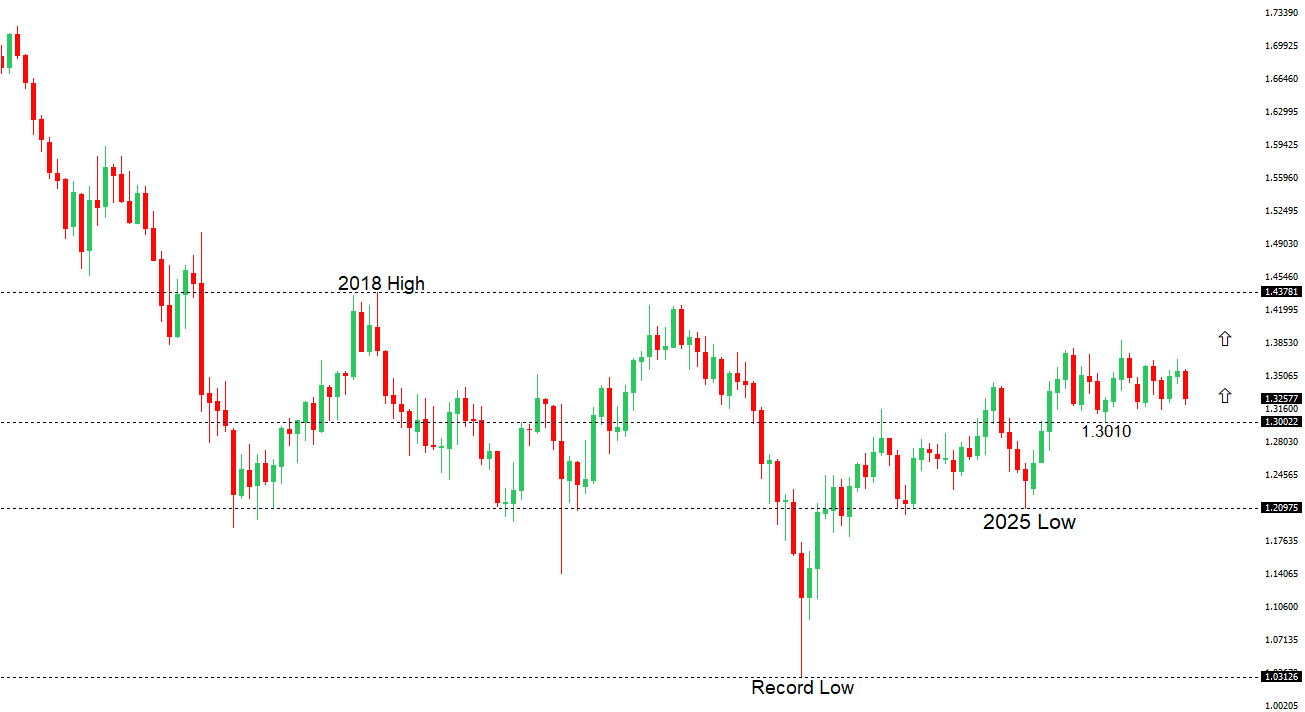 | ||
| R2 1.3407 - 17 September high - Medium R1 1.3300 - Figure - Medium S1 1.3181 - 15 October low - Medium S2 1.3137 - 14 October/2026 low - Strong | ||
| GBPUSD: fundamental overview | ||
| Sterling is balancing persistent UK inflation concerns against a cautious Bank of England outlook, with Governor Bailey describing above-target inflation as “enormously frustrating” while stressing it is too early to draw firm conclusions about broader wage and price pressures. His observation that second-round effects remain subdued, with businesses focused on cutting costs, tempers expectations for aggressive tightening and limits the pound’s interest rate support. Bailey’s assessment that the economy has proved more resilient than expected offers some encouragement, although his acknowledgment that growth remains insufficient highlights the difficult policy trade-off between containing inflation and supporting activity. | ||
| USDJPY: technical overview | ||
| The recent breakdown below 155.00 suggests the market could be on the verge of a bigger structural shift, with the possibility for an end to a longer-term uptrend and the start to a period of persistent weakness. Critical support now comes in the form of the 2026 low from January at 151.97, with a drop below to strengthen the bearish outlook and open the door for a major downside extension targeting the 2024 low at 139.58. The market would need to get back above 160.00 to take the immediate pressure off the downside. | ||
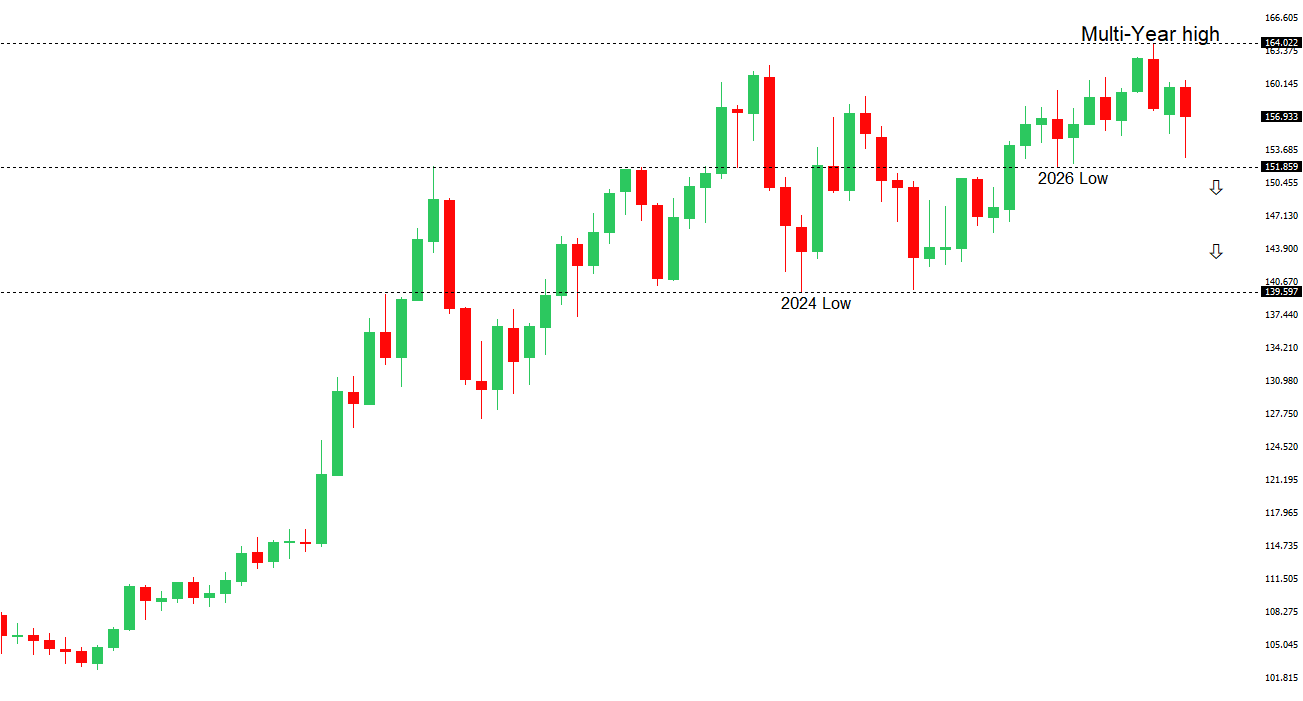 | ||
| R2 159.04 - 24 September high - Strong R1 158.34 - 15 October high - Medium S1 157.52 - 8 October low - Medium S2 156.37 - 30 September low - Strong | ||
| USDJPY: fundamental overview | ||
| The yen is under renewed pressure as hotter-than-expected US producer prices reinforce the message from the latest CPI report, strengthening expectations for further Fed tightening and supporting the dollar ahead of Kevin Warsh’s speech. However, hawkish signals from the Bank of Japan are providing some underlying support, with board member Koeda warning against excessive caution on rate hikes and highlighting upside inflation risks and scope for further policy normalization. The balance between US inflation concerns and expectations for additional Japanese tightening remains the key driver, while weaker risk appetite could offer the yen intermittent support. | ||
| AUDUSD: technical overview | ||
| There are signs of the formation of a longer-term base with the market recovering out from a meaningful longer-term support zone. The latest monthly close back above 0.7000 takes the big picture pressure off the downside and strengthens the case for a bottom, with the focus now on a push towards 0.8000. Setbacks should now be well supported ahead of 0.6700. | ||
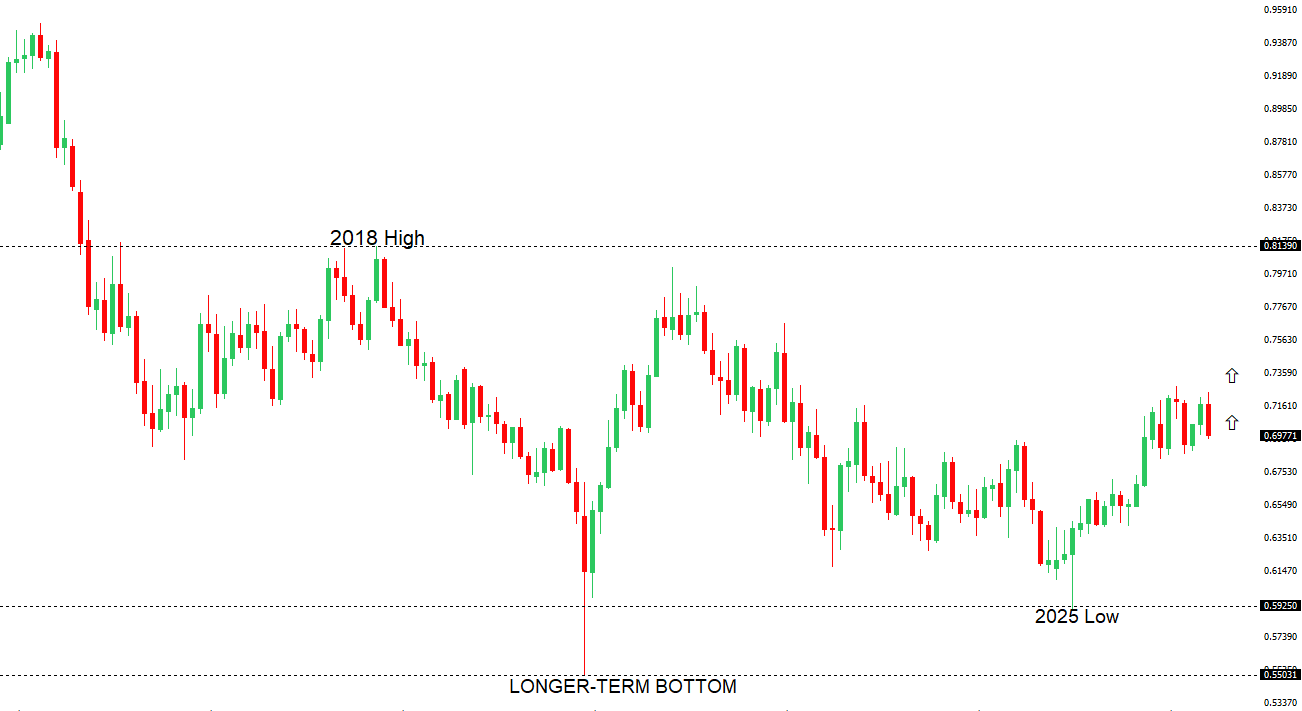 | ||
| R2 0.7046 - 24 September high - Medium R1 0.7014 - 14 October high - Medium S1 0.6894 - 15 October low - Medium S2 0.6865 - 30 June low - Strong | ||
| AUDUSD: fundamental overview | ||
| The Australian dollar remains under pressure as a sharp deterioration in domestic employment conditions prompts markets to scale back expectations for further RBA rate hikes. September’s unexpected fall in employment and rise in unemployment have weakened the currency’s interest rate support, leaving its recovery vulnerable to renewed US dollar demand. Stabilizing US Treasury yields, expectations for another Fed hike and persistent Middle East tensions are also weighing on sentiment towards the risk-sensitive Aussie. Attention now turns to Fed Chair Warsh’s remarks for guidance on the policy outlook, with a hawkish message potentially reinforcing pressure, while a more measured tone could offer some relief. | ||
| Suggested reading | ||
| Paul Tudor Jones worries about the 2027 outlook, J. Adinolfi, Marketwatch (October 13, 2026) Don’t Overstate AI’s Threat to Bank Profits, Fisher Investments (October 13, 2026) | ||