



|
||
| 30th October 2026 | view in browser | ||
| Bonds find buyers, stocks find doubts | ||
|
Markets head into Friday under pressure as concerns over AI spending weigh on equities, drive demand for bonds and leave currencies navigating falling yields and persistent geopolitical risks. |
||
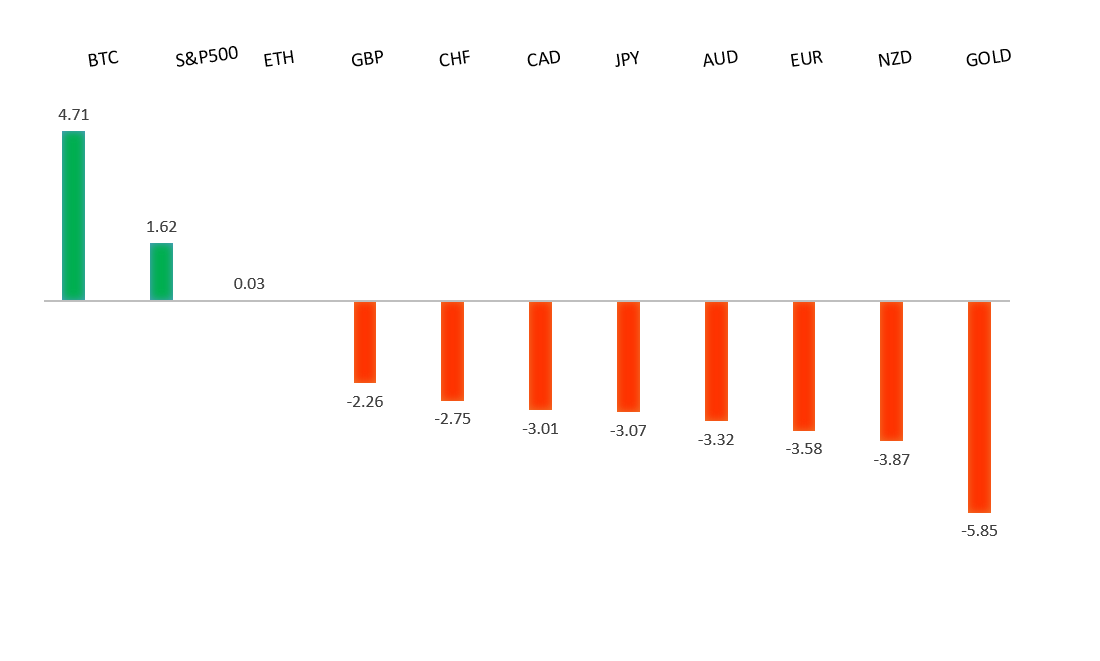
| Performance chart 30day v. USD (%) | ||
|
||
| Technical & fundamental highlights | ||
| EURUSD: technical overview | ||
|
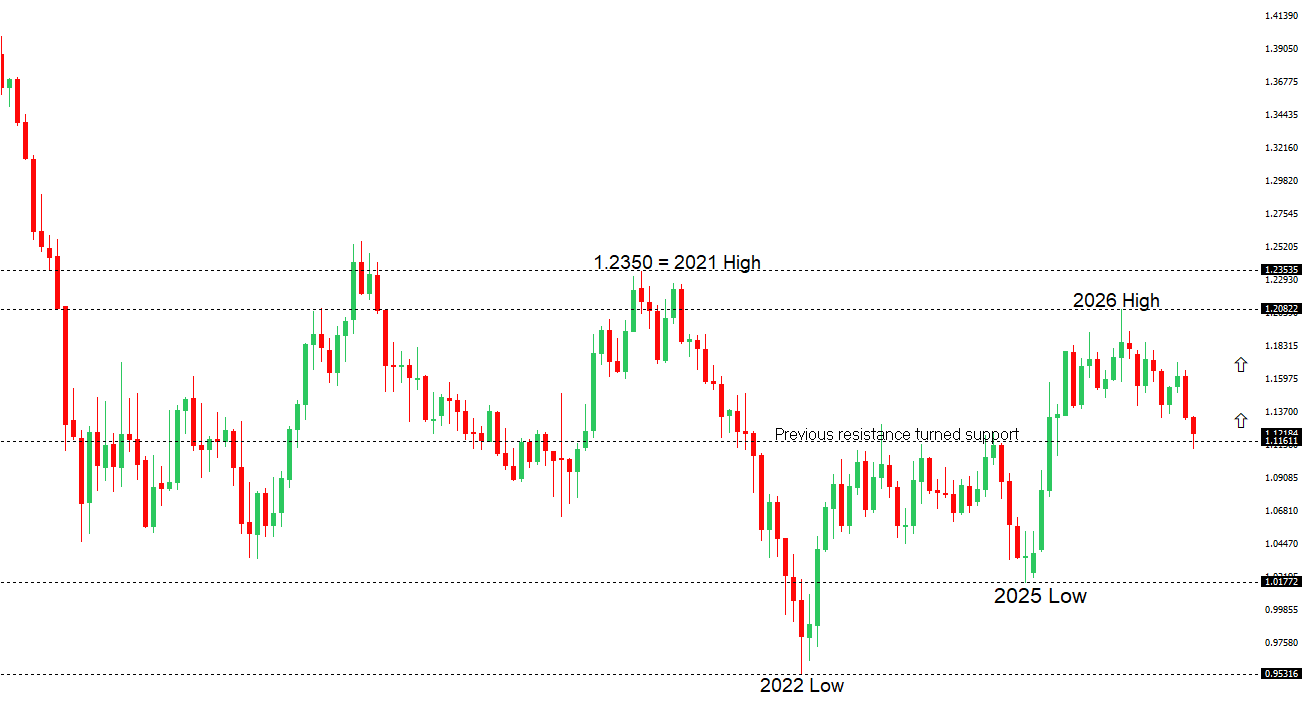
The Euro continues to show signs of wanting to carve out a major bottom after trading down to a 20-year low in 2022. Setbacks should be exceptionally well supported above 1.1000 on a weekly close basis ahead of the next major upside extension back above 1.2000. |
||
|
||
|
R2 1.1270
- 16 October high - Strong
R1 1.1215 - 30 October high - Medium S1 1.1104 - 29 October/2026 low - Strong S2 1.1100 - Figure - Medium |
||
| EURUSD: fundamental overview | ||
|
The euro is holding firmer after the ECB left interest rates unchanged but kept the door open to further tightening, with rising energy prices reinforcing concerns about inflation. Expectations of a possible December hike are providing support, although policymakers’ measured, data-dependent approach and broadly stable underlying inflation and wages temper the prospect of an aggressive policy response. The energy shock also threatens growth through weaker purchasing power and business confidence, leaving the euro caught between support from interest rate expectations and concerns over the economic outlook. Attention now turns to preliminary German and Eurozone growth figures for evidence of how well activity is holding up against higher energy costs and tighter financial conditions. |
||
| GBPUSD: technical overview | ||
|
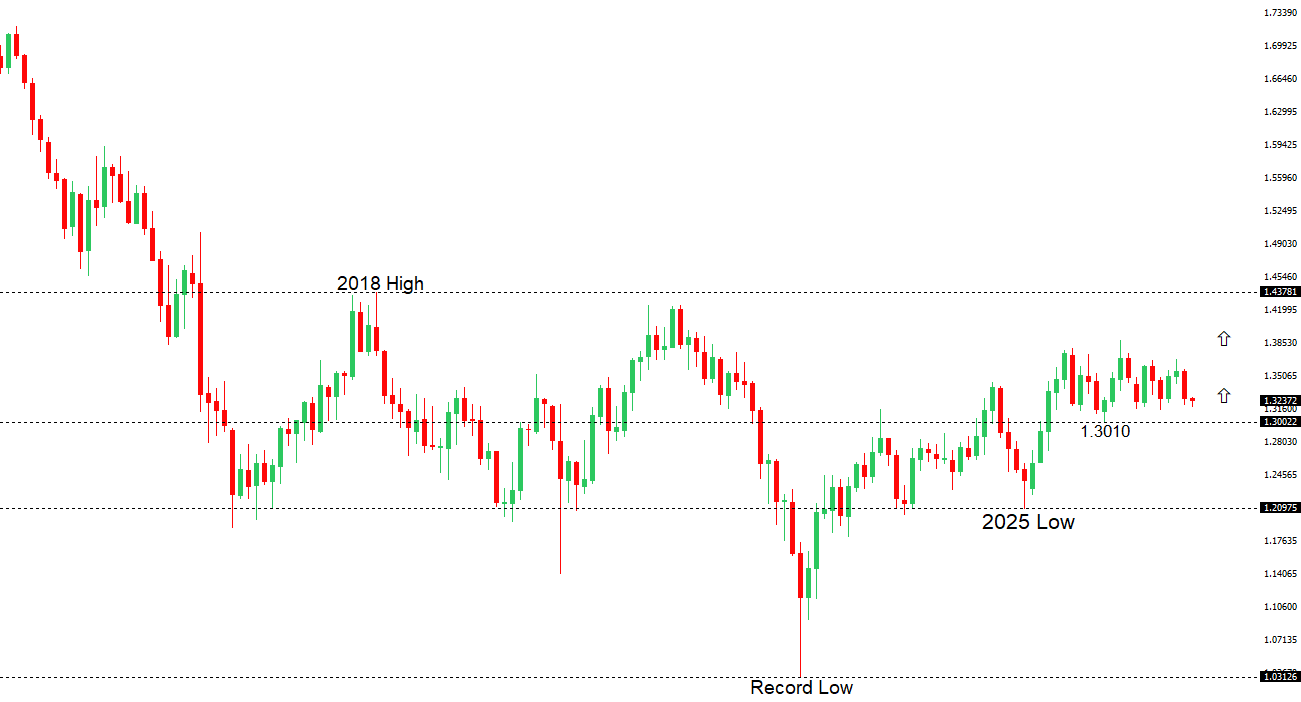
The Pound remains exceptionally well supported on dips into the 1.3000 area, with the price largely consolidating above the psychological barrier and previous resistance turned support in the form of the 2023 high. Look for the market to continue be well supported on dips ahead of the next major upside extension through the yearly high at 1.3870 and towards a retest of the 2018 high at 1.4377 further up. Only a monthly close below 1.3000 negates. |
||
|
||
|
R2 1.3498
- 16 September high - Medium
R1 1.3420 - 22 October high - Medium S1 1.3272 - 28 October low - Medium S2 1.3137 - 14 October/2026 low - Strong |
||
| GBPUSD: fundamental overview | ||
|
The pound is recovering against the dollar as markets digest a largely neutral UK Budget and persistent inflation pressures keep expectations for further Bank of England tightening in place. Modestly greater fiscal restraint appears insufficient to materially alter the policy outlook, while gilt issuance broadly matched expectations, limiting the Budget’s market impact. BoE policymaker Greene’s warnings that wage disinflation has stalled and second-round inflation risks have increased reinforce support for sterling through expectations that UK rates will remain elevated. However, the dollar continues to draw support from firm US inflation and expectations of further Fed tightening, leaving the pound’s recovery dependent partly on whether those hawkish US expectations begin to ease. |
||
| USDJPY: technical overview | ||
|
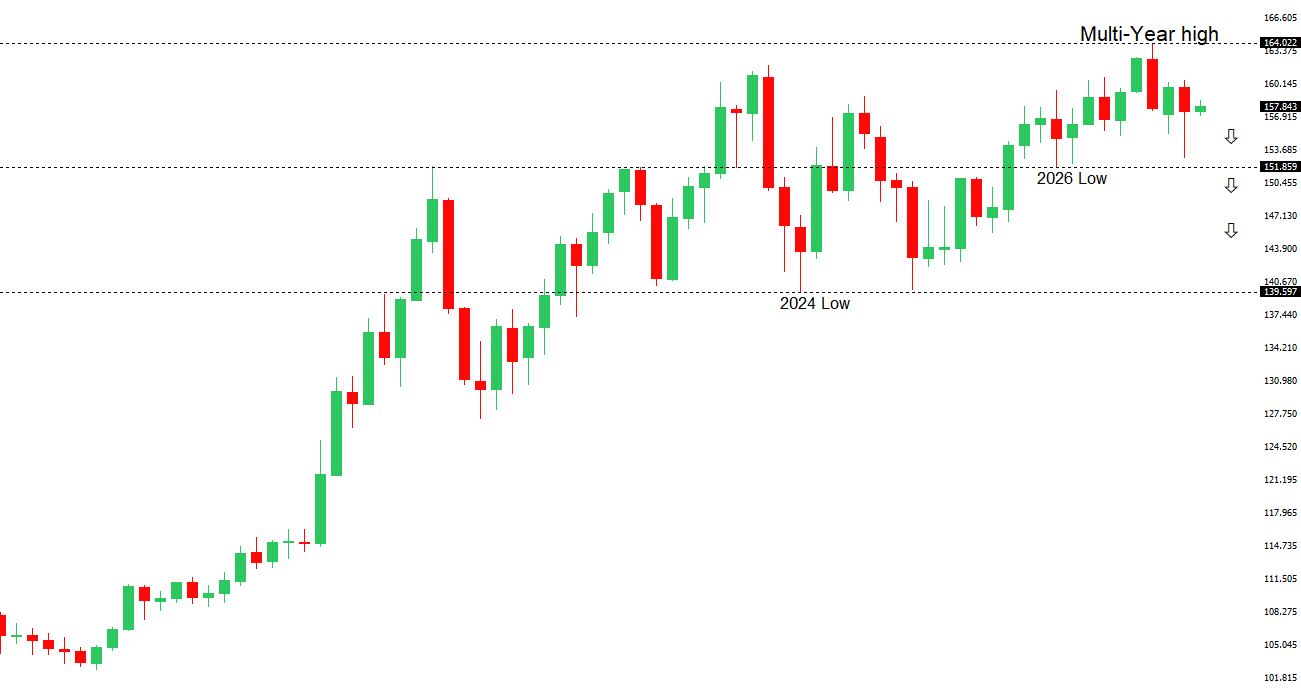
The recent breakdown below 155.00 suggests the market could be on the verge of a bigger structural shift, with the possibility for an end to a longer-term uptrend and the start to a period of persistent weakness. Critical support now comes in the form of the 2026 low from January at 151.97, with a drop below to strengthen the bearish outlook and open the door for a major downside extension targeting the 2024 low at 139.58. The market would need to get back above 160.00 to take the immediate pressure off the downside. |
||
|
||
|
R2 159.04
- 24 September high - Strong
R1 158.35 - 28 October high - Medium S1 156.07 - 23 October low - Medium S2 155.29 - 4 September low - Strong |
||
| USDJPY: fundamental overview | ||
|
The yen is strengthening as the Bank of Japan’s hawkish pause and firm Tokyo inflation reinforce expectations for a December rate hike. Although policymakers left rates unchanged, Takata’s dissent in favour of tightening and the Bank’s emphasis on upside inflation risks suggest further normalisation remains firmly on the agenda. Falling US Treasury yields are also narrowing the US–Japan yield gap, while hopes for progress in US–Iran diplomacy are weighing on the dollar. Attention now turns to Governor Ueda’s press conference for signals on the timing of the next hike and whether the Bank’s guidance can sustain the yen’s recovery. |
||
| AUDUSD: technical overview | ||
|
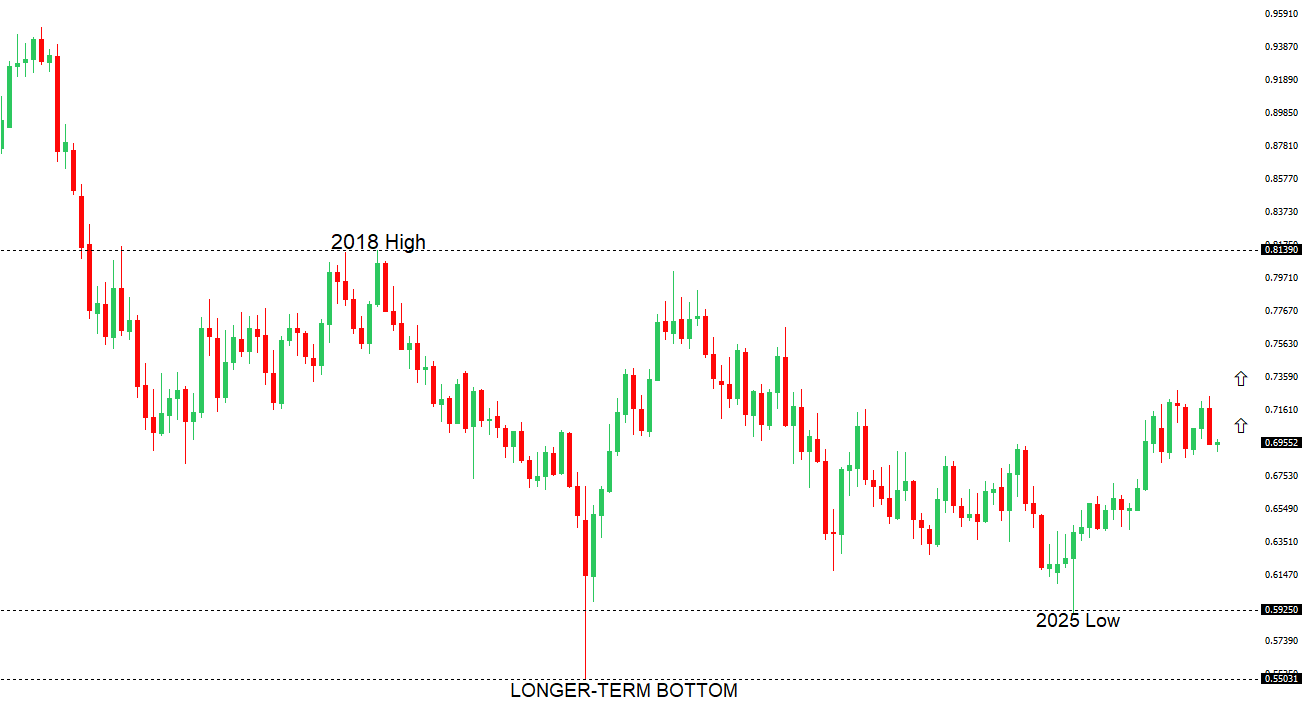
There are signs of the formation of a longer-term base with the market recovering out from a meaningful longer-term support zone. The latest monthly close back above 0.7000 takes the big picture pressure off the downside and strengthens the case for a bottom, with the focus now on a push towards 0.8000. Setbacks should now be well supported ahead of 0.6700. |
||
|
||
|
R2 0.7100
- Figure - Medium
R1 0.7068 - 29 October high - Medium S1 0.6970 - 20 October low - Medium S2 0.6894 - 15 October low - Strong |
||
| AUDUSD: fundamental overview | ||
|
The Australian dollar is drawing support from hotter-than-expected inflation and hawkish RBA commentary, which have strengthened expectations for a rate hike at next week’s meeting. Both headline and underlying price pressures have accelerated, with the quarterly trimmed mean measure reinforcing concerns that inflation remains too persistent. Governor Bullock’s warning that anticipated price pressures are starting to emerge has added to the case for further tightening, supporting the Aussie through expectations of higher domestic yields. However, the US policy backdrop remains a constraint: although the Fed held rates steady, its continued emphasis on price stability and two dissents favouring a hike have kept the prospect of further US tightening alive, limiting the Australian dollar’s upside against the greenback. |
||
| Suggested reading | ||
|
The S&P 500 isn’t the big winner you may think it is, B. Arends, MarketWatch (October 29, 2026) Why Being Right Can Make You a Worse Investor, A. Roth, Morningstar (October 29, 2026) |
||