


 | ||
| 16th January 2026 | view in browser | ||
| Calm surface, shifting currents | ||
| Markets head into Friday with a cautiously constructive tone, balancing easing inflation and supportive central bank signals against soft growth data and lingering policy uncertainty across major regions. | ||
| Performance chart 30day v. USD (%) | ||
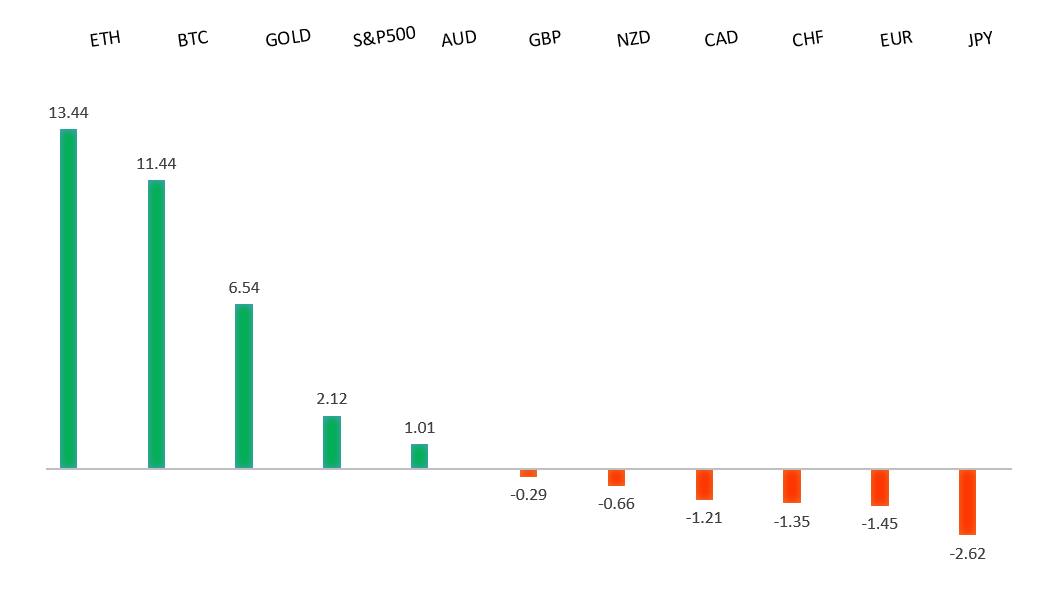 | ||
| Technical & fundamental highlights | ||
| EURUSD: technical overview | ||
| The Euro outlook remains constructive with higher lows sought out on dips in favor of the next major upside extension targeting the 2021 high at 1.2350. Setbacks should be exceptionally well supported ahead of 1.1400. | ||
 | ||
| R2 1.1808 - 24 December high -Strong R1 1.1699 - 12 Janaury high - Medium S1 1.1593 - 16 January /2026 low - Medium S2 1.1530 - 7 November low - Medium | ||
| EURUSD: fundamental overview | ||
| Recent U.S. data continue to look far more resilient than weak euro-area numbers. Germany returned to modest growth in 2025 after two years of contraction, helped by a big shift toward defense and infrastructure spending, but the recovery remains fragile amid weak exports, a manufacturing slump, and rising Chinese competition. While some see echoes of West Germany’s successful industrial pivot in the 1980s, markets remain unconvinced. The Euro is struggling to gain traction as the euro-area trade surplus narrows, imports outpace exports, and ECB projections point to only around 0.2% GDP growth in Q4 with clear downside risks. | ||
| USDJPY: technical overview | ||
| There are signs of a meaningful top in place after the market put in a multi-year high in 2024. At this point, rallies should be well capped ahead of 160.00 ahead of a fresh down-leg back towards the 2024 low at 139.58. A break below 154.39 will strengthen the outlook. | ||
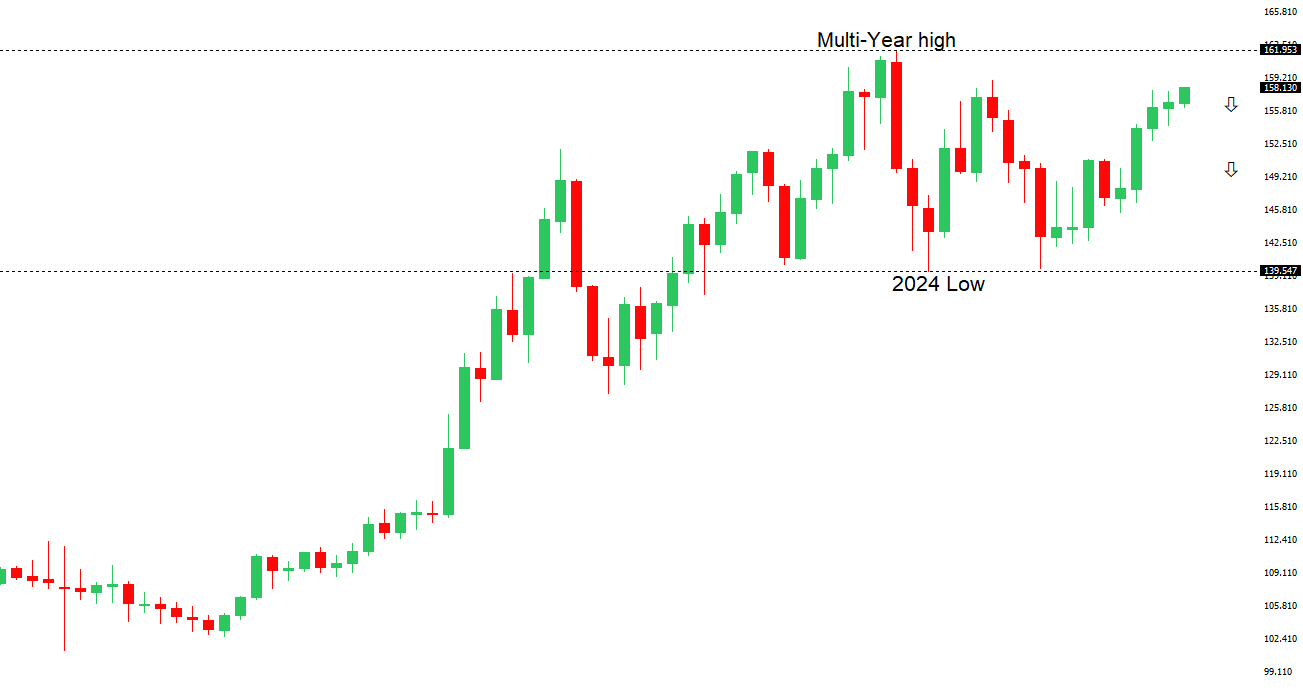 | ||
| R2 160.00 - Psychological - Strong R1 159.46 - 14 January /2026 high - Medium S1 157.52 - 12 January low - Medium S2 156.11 - 5 January/2026 low - Strong | ||
| USDJPY: fundamental overview | ||
| We’ve been seeing some Yen demand on long USD profit-taking and intervention talk, with U.S. and Japanese officials stepping up the jawboning. While the BOJ is likely to stay on hold in the very near term, officials are increasingly signalling that a persistently weak yen could actually bring forward future rate hikes, as depreciation is pushing up import prices and keeping inflation near or above target. For now, wide yield differentials and a gradualist BOJ keep the yen biased weaker, but the growing economic and political costs of a cheap currency mean that further losses raise the risk of a stronger policy response or FX intervention. | ||
| AUDUSD: technical overview | ||
| There are signs of the potential formation of a longer-term base with the market trading down into a meaningful longer-term support zone. Only a monthly close below 0.5500 would give reason for rethink. A monthly close back above 0.7000 will take the big picture pressure off the downside and strengthen case for a bottom. | ||
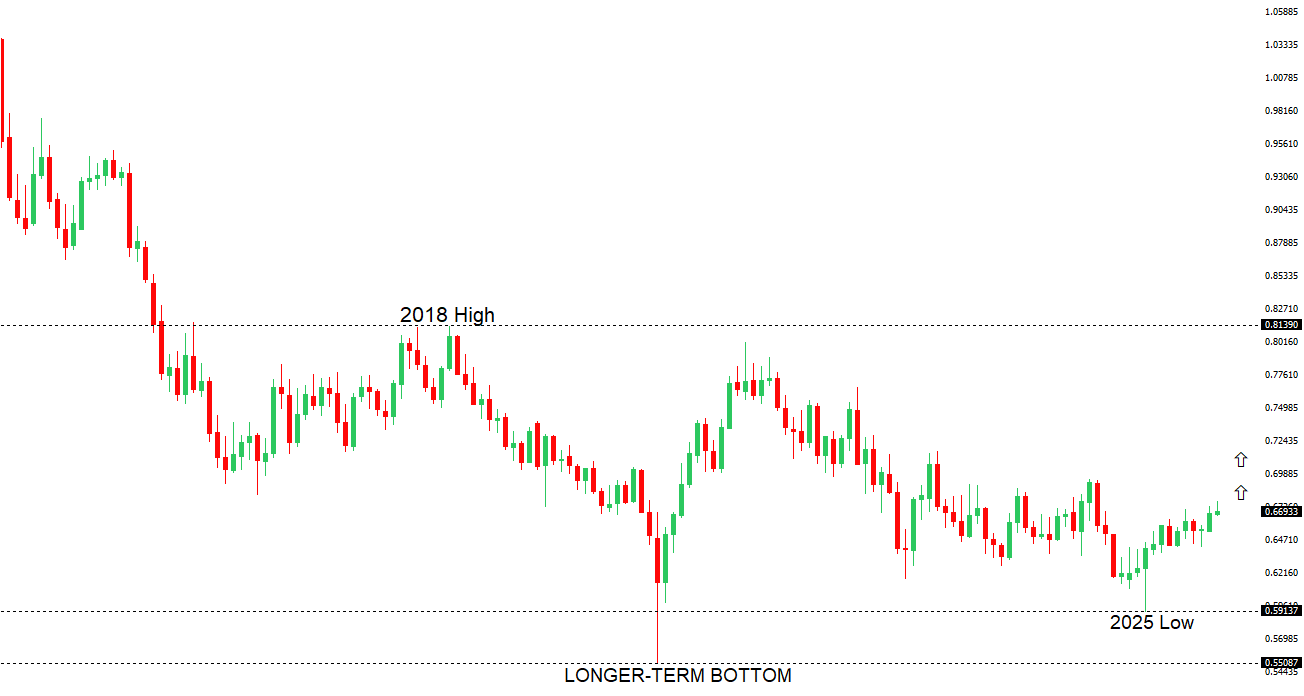 | ||
| R2 0.6800 - Figure - Medium R1 0.6767 - 7 January/2026 high - Medium S1 0.6660 - 31 December low - Medium S2 0.6592 - 18 December low - Strong | ||
| AUDUSD: fundamental overview | ||
| Markets are increasingly pricing a possible RBA rate hike by mid-2026, with some economists even flagging February as a risk, though views remain split as others expect rates to stay on hold until inflation proves more persistent. The next key test will be December jobs data (Jan 22) and Q4 inflation (Jan 28) ahead of the Feb 2–3 RBA meeting. AUD upside remains cautious amid sticky US inflation, rising geopolitical risks, and uncertainty around Trump-related developments, while speculators have sharply reduced short positions and now appear to be waiting for fresh catalysts. | ||
| Suggested reading | ||
| 10 Breakthrough Technologies 2026, A. Nordrum, MIT Technology Review (January 12, 2026) The Haves, Have-Nots & Have-Lots Economy, J. VandeHei, Axios (January 9, 2026) | ||