


 | ||
| 23rd January 2026 | view in browser | ||
| Central banks steady, risks simmer | ||
| Global macro is steady but cautious: the BOJ stayed on hold with a tightening bias as Japan inflation cooled, China signaled tolerance for slower growth alongside a firmer RMB, geopolitical and US policy headlines linger, and markets look to upcoming UK, European and US data for near-term direction while US equity futures edge higher. | ||
| Performance chart 30day v. USD (%) | ||
 | ||
| Technical & fundamental highlights | ||
| EURUSD: technical overview | ||
| The Euro outlook remains constructive with higher lows sought out on dips in favor of the next major upside extension targeting the 2021 high at 1.2350. Setbacks should be exceptionally well supported ahead of 1.1400. | ||
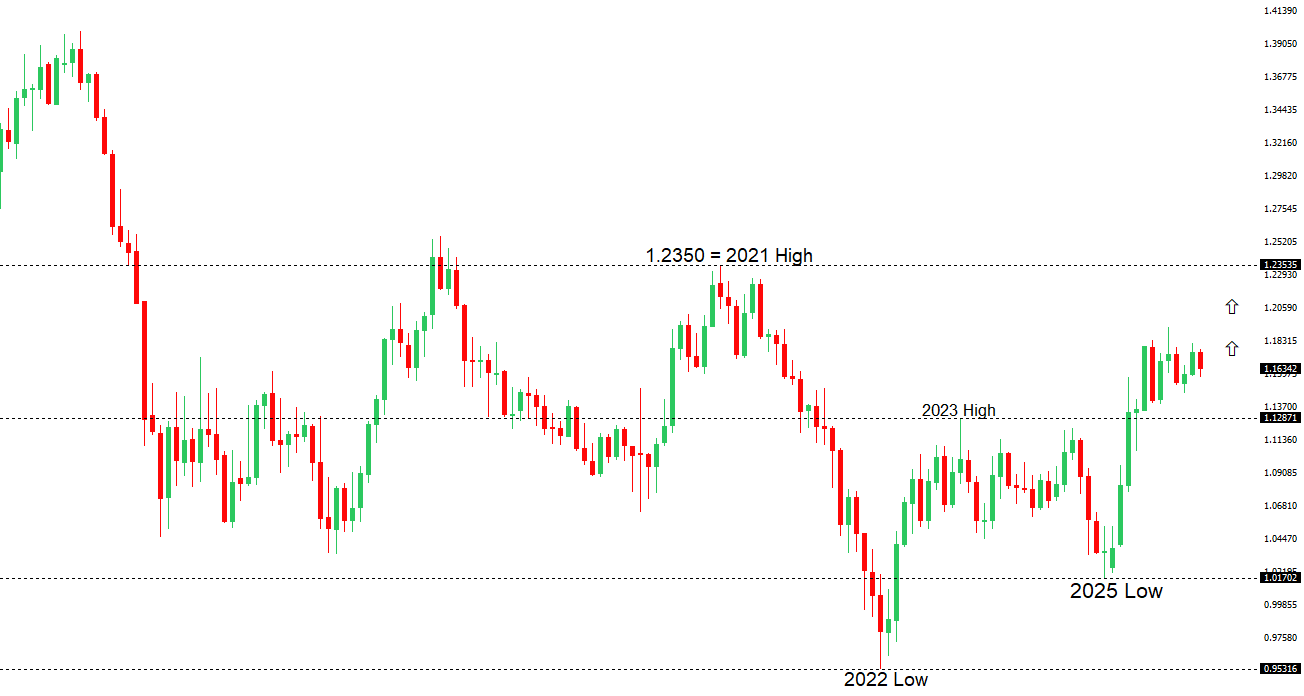 | ||
| R2 1.1808 - 24 December high -Strong R1 1.1769 - 20 Janaury high - Medium S1 1.1632 - 20 January low - Medium S2 1.1577 - 19 January /2026 low - Strong | ||
| EURUSD: fundamental overview | ||
| Euro price action has been dominated by political headlines, particularly around renewed US–Greenland tensions. Conflicting signals from Washington, NATO, Denmark, and Greenland itself suggest the issue could linger, risking fresh transatlantic friction that may revive de-dollarization flows and favor euro assets as an alternative safe haven. Separately, ECB officials said policy is “in a good place” but not on autopilot, with many favoring a prolonged hold on rates amid a fragile recovery, weak consumption, and limited domestic inflation pressure. While some policymakers see downside risks from factors like US tariffs, others warn that wage growth and sticky services inflation could still pose upside risks. | ||
| USDJPY: technical overview | ||
| There are signs of a meaningful top in place after the market put in a multi-year high in 2024. At this point, rallies should be well capped ahead of 160.00 ahead of a fresh down-leg back towards the 2024 low at 139.58. A break below 154.39 will strengthen the outlook. | ||
 | ||
| R2 160.00 - Psychological - Strong R1 159.46 - 14 January /2026 high - Medium S1 157.42 - 19 January low - Medium S2 156.11 - 5 January/2026 low - Strong | ||
| USDJPY: fundamental overview | ||
| USD/JPY ticked up after the BOJ left rates unchanged at 0.75%, with markets focused less on the decision and more on Governor Ueda’s messaging around yen weakness, inflation risks, and the timing of the next move. With a snap election looming, Ueda is expected to avoid firm guidance, carefully balancing concerns that further yen depreciation could accelerate hikes against political sensitivities and bond-market stress. While growth forecasts may be revised higher and inflation data show headline pressures easing on subsidies, underlying inflation remains firm, keeping expectations intact for another BOJ rate increase around mid-year despite today’s steady stance. | ||
| AUDUSD: technical overview | ||
| There are signs of the potential formation of a longer-term base with the market trading down into a meaningful longer-term support zone. Only a monthly close below 0.5500 would give reason for rethink. A monthly close back above 0.7000 will take the big picture pressure off the downside and strengthen case for a bottom. | ||
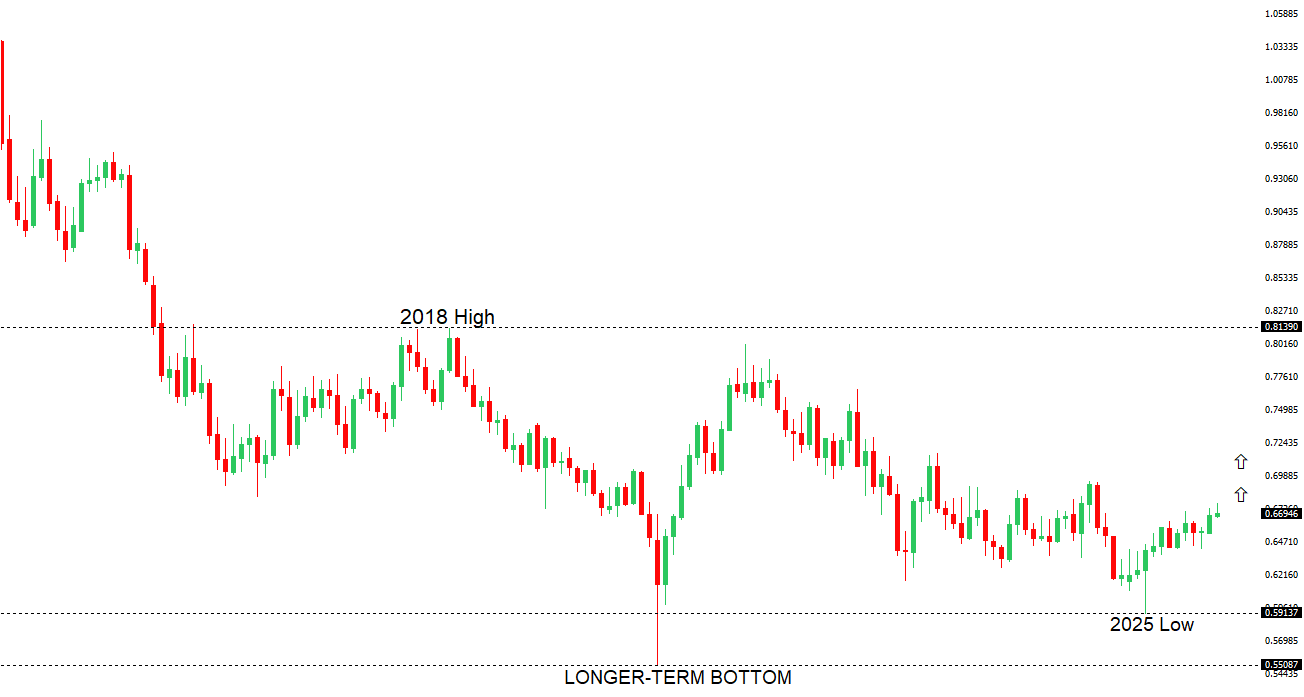 | ||
| R2 0.6900 - Figure - Medium R1 0.6853 - 23 January/2026 high - Medium S1 0.6753 - 22 January low - Medium S2 0.6660 - 31 December low - Strong | ||
| AUDUSD: fundamental overview | ||
| The Australian Dollar is tracking near a 15-month high around 0.6850, underpinned by a much stronger-than-expected December jobs report and improving January flash PMIs, both of which have lifted expectations for an RBA rate hike. Employment rose sharply, led by full-time jobs, while unemployment fell to 4.1%, reinforcing the view of genuine labor-market strength. As a result, markets have repriced February hike odds from roughly 25–30% to around 50–60%, with a move fully priced by May, though the RBA is still expected to remain broadly gradual. The next CPI print is now decisive: a firm outcome could turn a February hike into the base case and extend the AUD’s upside, while recent PMIs already point to a clear re-acceleration in domestic growth, led by services. | ||
| Suggested reading | ||
| This Indicator Just Flashed Most Bullish Signal Since ’00, M. Hulbert, Marketwatch (January 21, 2026) The Real Secret To Warren Buffett’s Investing Success, L. Swedroe, Morningstar (January 22, 2026) | ||