


 | ||
| 30th July 2025 | view in browser | ||
| Dollar dominates as global trade tilts | ||
| The Dollar Index has surged to its highest level since early June, driven by favorable trade developments that have prompted investors to unwind bearish bets. | ||
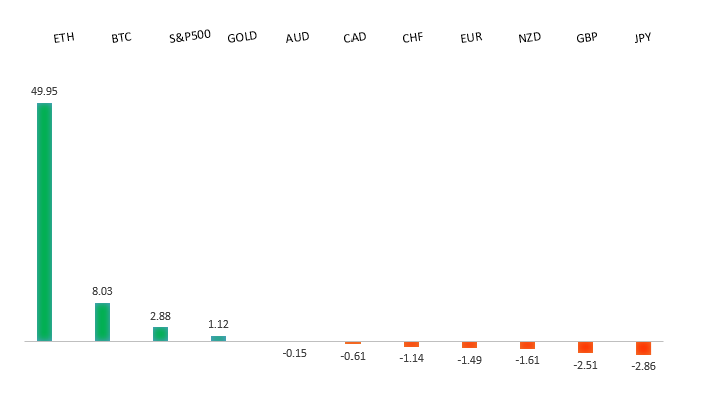
| Performance chart 30day v. USD (%) | ||
 | ||
| Technical & fundamental highlights | ||
| EURUSD: technical overview | ||
| The Euro has broken out from a multi-month consolidation off a critical longer-term low. This latest push through the 2023 high (1.1276) lends further support to the case for a meaningful bottom, setting the stage for a bullish structural shift and the next major upside extension targeting the 2021 high at 1.2350. Setbacks should be exceptionally well supported ahead of 1.1000. | ||
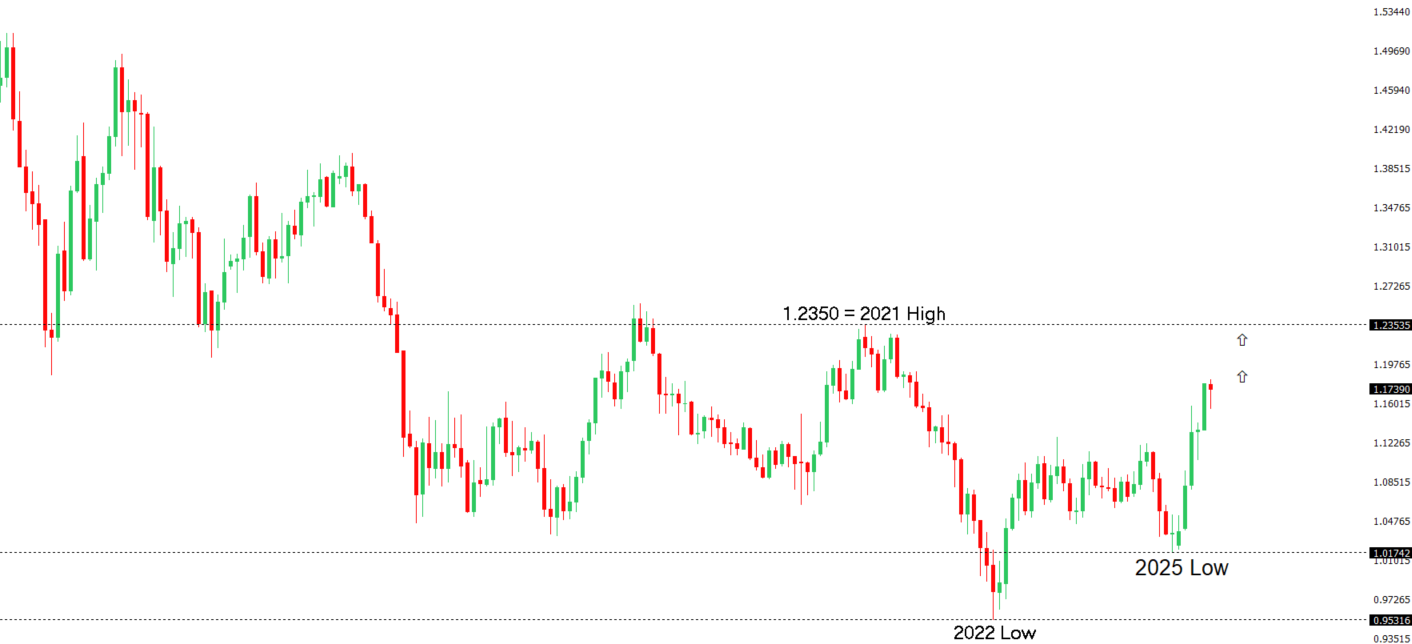 | ||
| R2 1.1789 - 24 July high - Medium R1 1.1700 - Figure - Medium S1 1.1519 - 29 July low - Medium S2 1.1446 - 19 June low - Strong | ||
| EURUSD: fundamental overview | ||
| Euro area inflation expectations dipped slightly to 2.6% for one year, while three-year expectations held steady at 2.4%, according to the ECB. ECB officials, including Gabriel Makhlouf and President Christine Lagarde, see no rush to cut interest rates, citing stable inflation and steady growth, though a new 15% US tariff on EU goods could slow economic progress despite reducing trade uncertainty. The euro weakened sharply after a perceived lopsided US-EU trade deal, sparking criticism of European Commission President Ursula von der Leyen and fueling market concerns that the non-binding agreement might unravel, with formal negotiations potentially taking years. European leaders and markets are now grappling with the deal’s implications, but some see it as a chance to push for economic reforms and diversify trade partnerships, while markets may soon focus on the EU avoiding a worse outcome and the possibility of prolonged ECB rate pauses. | ||
| USDJPY: technical overview | ||
| There are signs of a meaningful top in place after the market put in a multi-year high in 2024. At this point, the door is now open for a deeper setback below the 2024 low at 139.58, exposing a retest of the 2023 low. Rallies should be well capped below 152.00. | ||
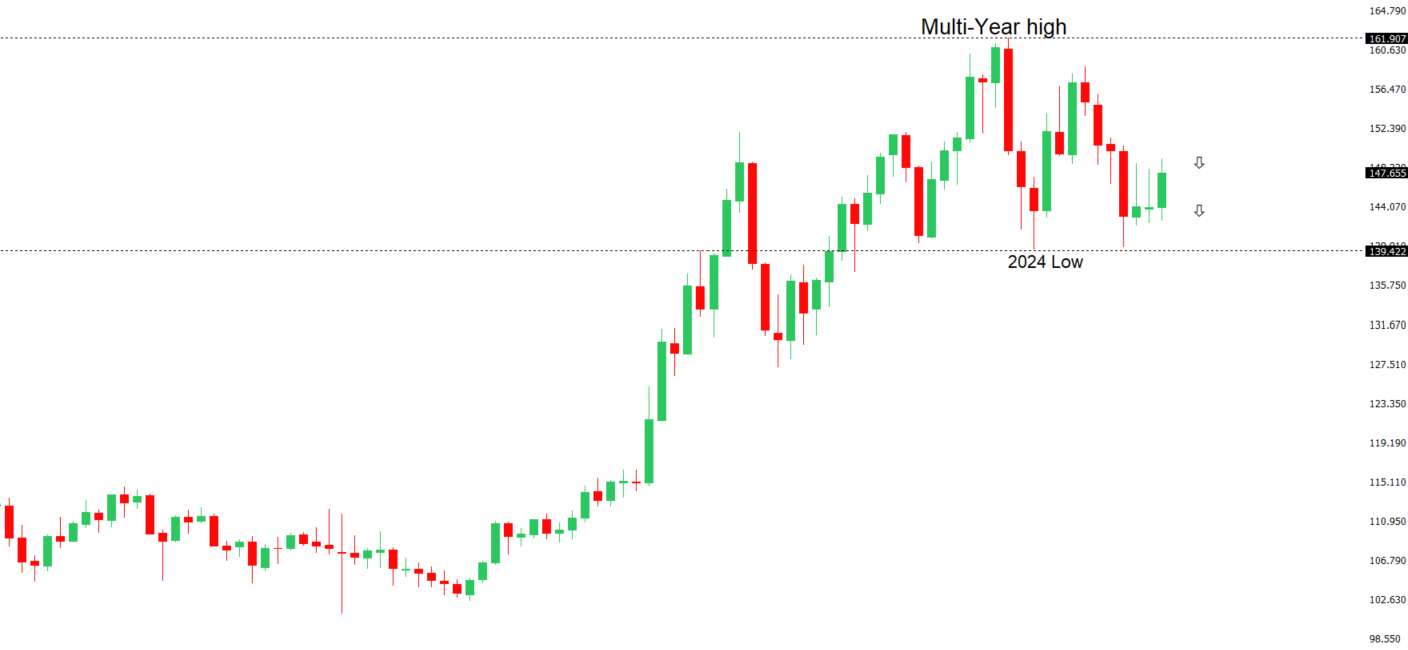 | ||
| R2 150.00 - Psychological - Strong R1 149.19 - 16 July high - Medium S1 146.81 - 25 July low - Medium S2 145.85 - 24 July low - Strong | ||
| USDJPY: fundamental overview | ||
| Political turmoil in Japan is intensifying as a backlash against a US-Japan trade deal, criticized for threatening sovereignty, fuels speculation that Prime Minister Ishiba may be forced to resign. The deal, involving a disputed $550 billion Japanese investment in the US with unclear profit-sharing terms, has sparked confusion and market concerns, potentially weakening the yen further. As the Bank of Japan adopts a cautious “risk management” approach amid political and economic uncertainties, markets expect steady policy, which could pressure the yen if perceived as dovish. Upcoming June retail sales, industrial production, and housing data, particularly strong retail figures from firms like UNIQLO, may influence yen trading ahead of the BOJ meeting, while business leaders urge rate hikes to counter yen weakness and rising inflation. | ||
| AUDUSD: technical overview | ||
| There are signs of the potential formation of a longer-term base with the market trading down into a meaningful longer-term support zone. Only a monthly close below 0.5500 would give reason for rethink. A monthly close back above 0.7000 will take the big picture pressure off the downside and strengthen case for a bottom. | ||
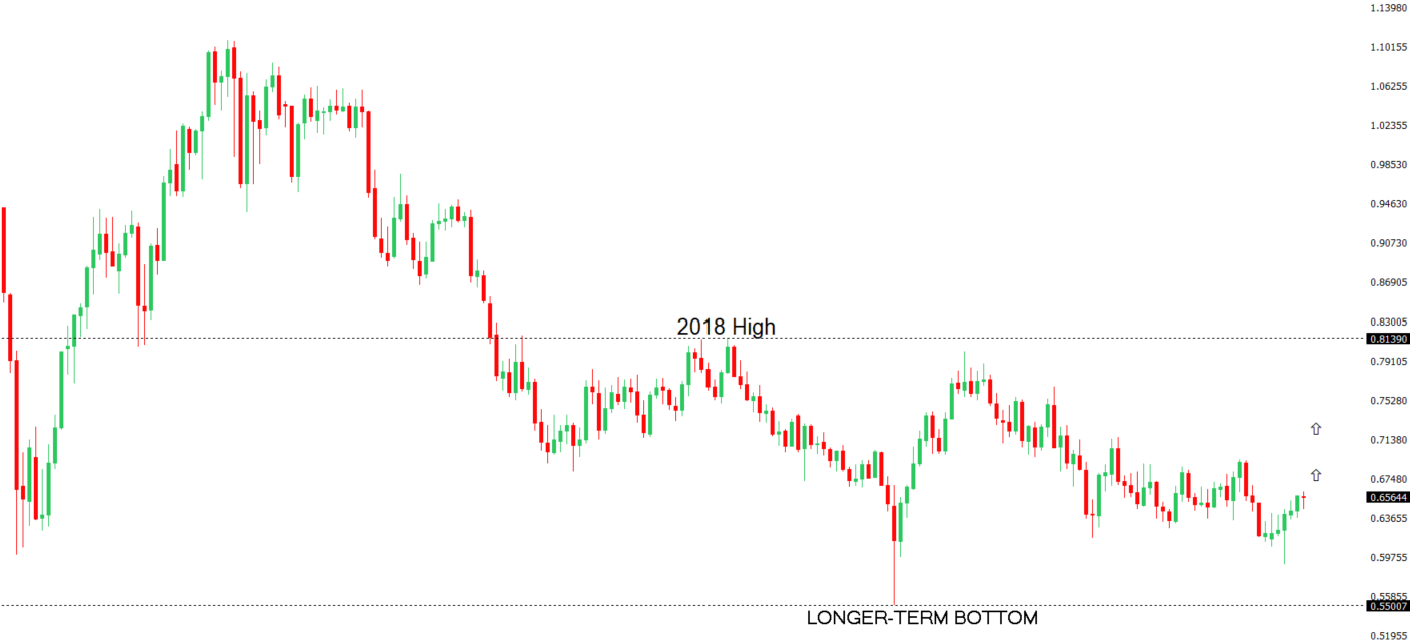 | ||
| R2 0.6688 - 7 November 2024 high - Strong R1 0.6625 - 24 July/2025 high - Medium S1 0.6454 - 17 July low - Medium S1 0.6373 - 23 June low - Strong | ||
| AUDUSD: fundamental overview | ||
| Markets are focused on US-China trade talks in Stockholm, with a potential extension of the August 12 truce deadline possibly boosting antipodean currencies like the Australian dollar. Australia’s Q2 CPI, due today, is expected to show inflation easing to 2.2% year-on-year, nearing the Reserve Bank of Australia’s 2%-3% target, potentially paving the way for a rate cut at the RBA’s August 11-12 meeting. However, RBA Governor Bullock’s recent comments on a resilient labor market and gradual inflation decline have tempered expectations for aggressive rate cuts, with markets now less certain of an August cut and scaling back hopes for consecutive cuts without stronger evidence of economic slowdown. | ||
| Suggested reading | ||
| Can new technologies supercharge solar power?, R. Millard, Financial Times (July 29, 2025) As Ether Outperforms Bitcoin, What’s Going on With Crypto?, C. Reilly, RiskHedge (July 28, 2025) | ||