


 | ||
| 1st April 2026 | view in browser | ||
| Dollar down as markets test risk appetite | ||
| The dollar weakens into April as risk sentiment tentatively improves on shifting US-Iran headlines, though ongoing geopolitical tensions keep markets focused on incoming macro data and central bank signals for direction. | ||
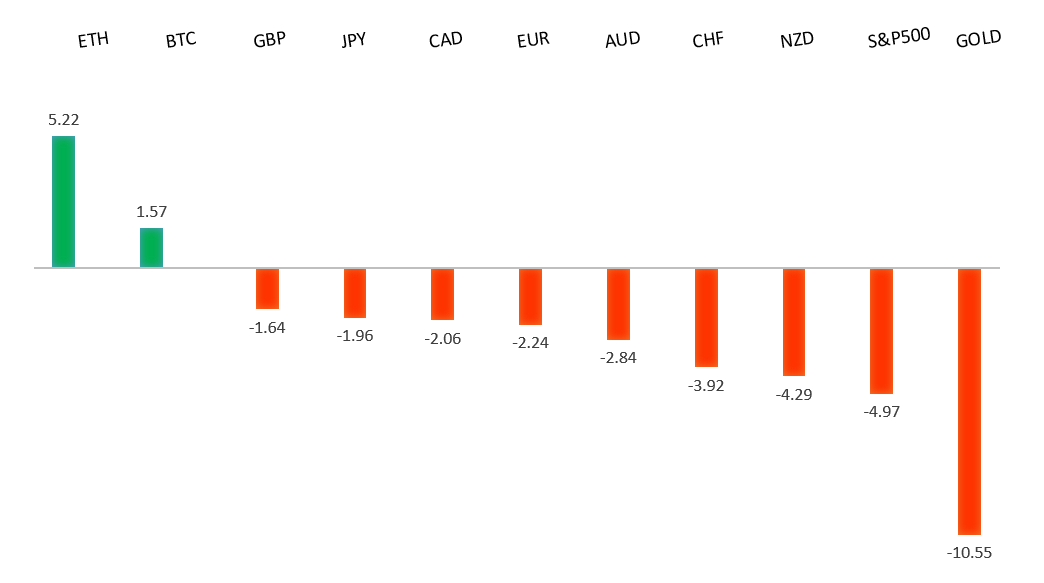
| Performance chart 30day v. USD (%) | ||
 | ||
| Technical & fundamental highlights | ||
| EURUSD: technical overview | ||
| The Euro outlook remains constructive with higher lows sought out on dips in favor of the next major upside extension targeting the 2021 high at 1.2350. Setbacks should be exceptionally well supported ahead of 1.1300. | ||
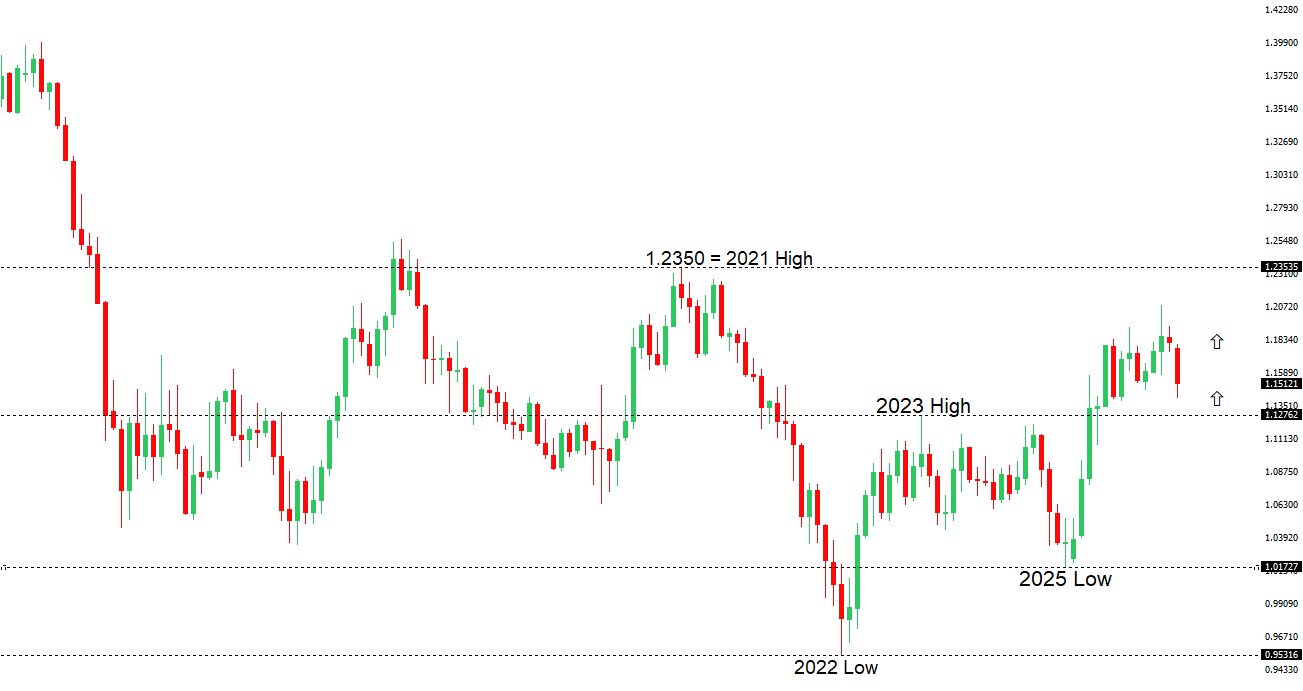 | ||
| R2 1.1668 - 10 March high - Strong R1 1.1641 - 23 March high - Medium S1 1.1443 - 30 March low - Medium S2 1.1411 - 13 March/2026 low - Strong | ||
| EURUSD: fundamental overview | ||
| The euro has rebounded, supported by a softer dollar and tentative signs of geopolitical de-escalation. The latest data highlighted a mixed macro backdrop, with Eurozone inflation picking up to 2.5% YoY driven by energy costs, while core inflation eased and growth indicators—such as German retail sales and French consumption—remained weak, reinforcing a stagflationary tone. European Central Bank officials have acknowledged this balance, signaling caution as policymakers weigh persistent inflation risks against softening demand. For now, the euro’s outlook remains finely balanced, with upside limited by weak activity even as inflation keeps the ECB from turning decisively dovish, while upcoming labor market and PMI data will be key in shaping expectations. | ||
| USDJPY: technical overview | ||
| There are signs of the formation of a meaningful top after the market put in a multi-year high in 2024. At this point, rallies should be well capped above 160.00 in favor of a fresh down-leg back towards the 2024 low at 139.58. Only a monthly close above 160.00 negates. | ||
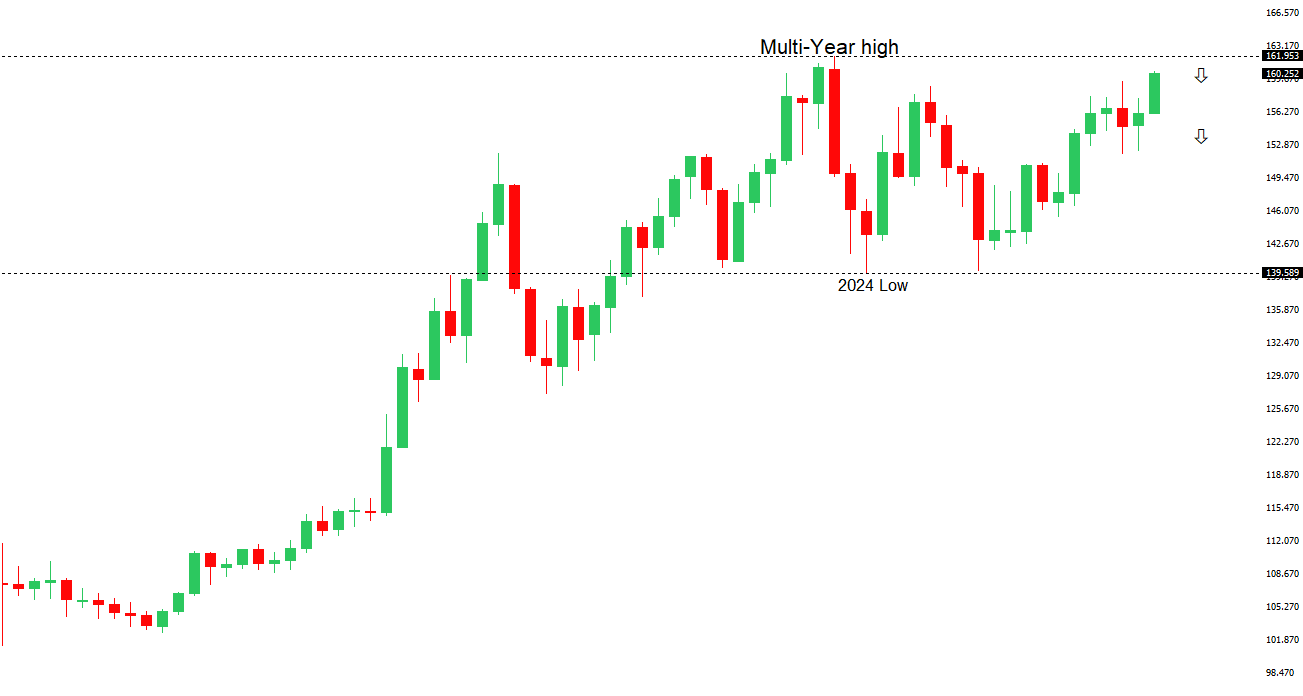 | ||
| R2 161.00 - Figure - Strong R1 160.46 - 30 March/2026 high - Medium S1 158.02 - 23 March low - Medium S2 157.51 - 19 March low - Strong | ||
| USDJPY: fundamental overview | ||
| Japan’s latest data points to resilient but cautious economic conditions, with the Bank of Japan Q1 Tankan survey showing improved business sentiment across both manufacturing and services, even as firms grow more cautious on the outlook and scale back capital expenditure plans. Meanwhile, the final March manufacturing PMI was revised slightly higher and remained in expansion territory, though momentum has softened from February, with easing output and demand. Rising input costs—driven by energy prices, a weaker yen, and labor shortages—are also becoming more pronounced, with companies increasingly passing these pressures on to consumers. | ||
| AUDUSD: technical overview | ||
| There are signs of the formation of a longer-term base with the market recovering out from a meaningful longer-term support zone. The latest monthly close back above 0.7000 takes the big picture pressure off the downside and strengthens the case for a bottom, with the focus now on a push towards 0.8000. Setbacks should now be well supported ahead of 0.6700. | ||
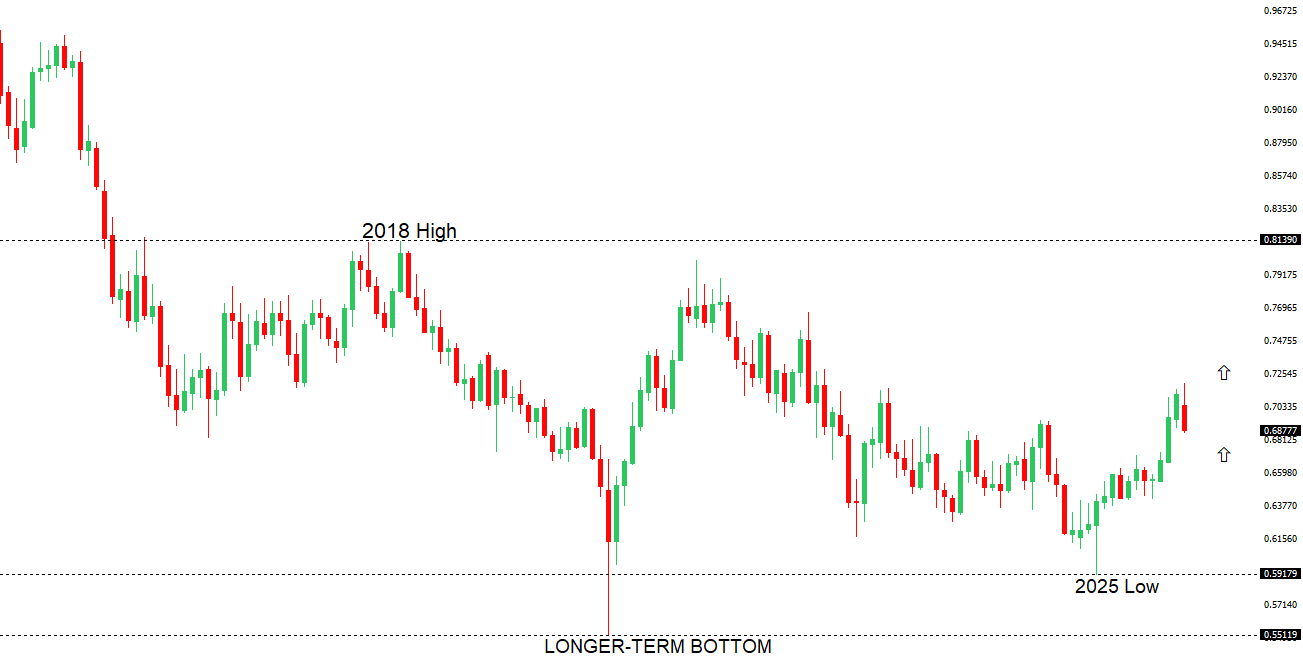 | ||
| R2 0.7188 - 11 March/2026 high - Strong R1 0.7000 - Psychological - Medium S1 0.6833 - 30 March low - Medium S2 0.6767 - 7 January high - Strong | ||
| AUDUSD: fundamental overview | ||
| Australia’s latest data highlights a sharp divergence in the economy, with a strong rebound in housing—driven by a surge in apartment approvals—contrasting with a steep downturn in manufacturing. While dwelling approvals jumped to near five-year highs and housing activity shows resilience, the manufacturing sector has slipped back into contraction, with sentiment, employment, and capacity utilization all deteriorating sharply amid rising energy costs and supply chain disruptions. In short, a housing-led recovery is being overshadowed by a renewed industrial slowdown, as geopolitical energy shocks weigh heavily on the sector. | ||
| Suggested reading | ||
| Our Sour Mood Isn’t New, Not Related to Now, J. Calhoun, Alhambra (March 29, 2026) Why Bottom For This Stock Market Is Closer Than You Think, J. Sonenshine, Barron’s (March 27, 2026) | ||