


 | ||
| 31st March 2026 | view in browser | ||
| Markets eye data deluge in pivotal session | ||
| Markets enter the new day cautiously constructive, with EURUSD stabilizing amid rising Eurozone inflation expectations, softer oil offering support, and focus shifting to key US labor data and central bank signals against a backdrop of month and quarter-end US Dollar flow dynamics. | ||
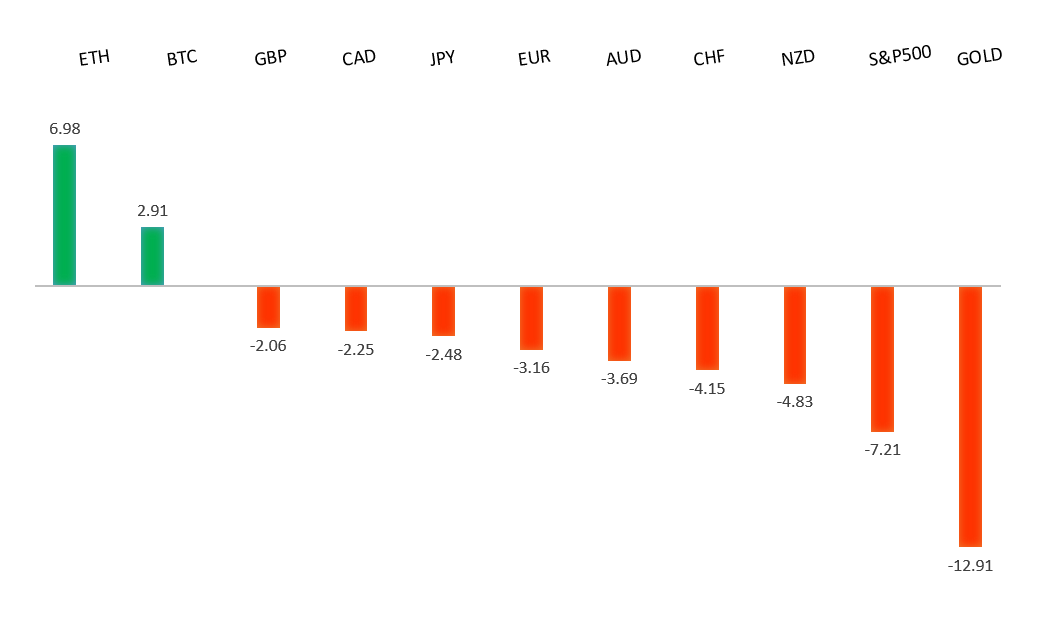
| Performance chart 30day v. USD (%) | ||
 | ||
| Technical & fundamental highlights | ||
| EURUSD: technical overview | ||
| The Euro outlook remains constructive with higher lows sought out on dips in favor of the next major upside extension targeting the 2021 high at 1.2350. Setbacks should be exceptionally well supported ahead of 1.1300. | ||
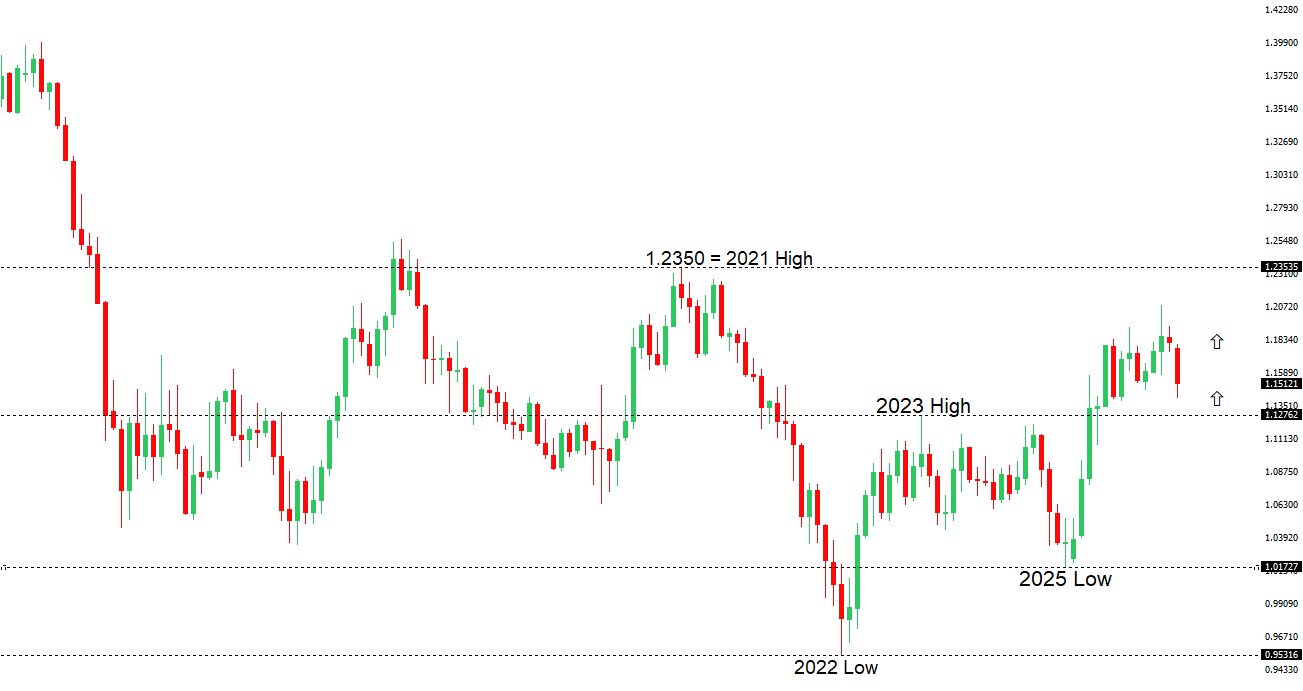 | ||
| R2 1.1668 - 10 March high - Strong R1 1.1641 - 23 March high - Medium S1 1.1443 - 30 March low - Medium S2 1.1411 - 13 March/2026 low - Strong | ||
| EURUSD: fundamental overview | ||
| The euro is trying to hold up after five straight days of declines. Recent data showed a renewed rise in eurozone inflation, led by Germany, pointing to stronger price pressures, while growth indicators weakened, with softer confidence and slower retail sales suggesting cooling demand. This mix highlights a stagflationary backdrop, a risk also flagged by ECB Stournaras, who warned that escalating Middle East tensions could trigger an energy shock and further complicate the outlook. Overall, while higher inflation may make the ECB more cautious on rate cuts, weak growth, rising energy costs, and a stronger dollar continue to weigh on the euro. | ||
| USDJPY: technical overview | ||
| There are signs of the formation of a meaningful top after the market put in a multi-year high in 2024. At this point, rallies should be well capped above 160.00 in favor of a fresh down-leg back towards the 2024 low at 139.58. Only a monthly close above 160.00 negates. | ||
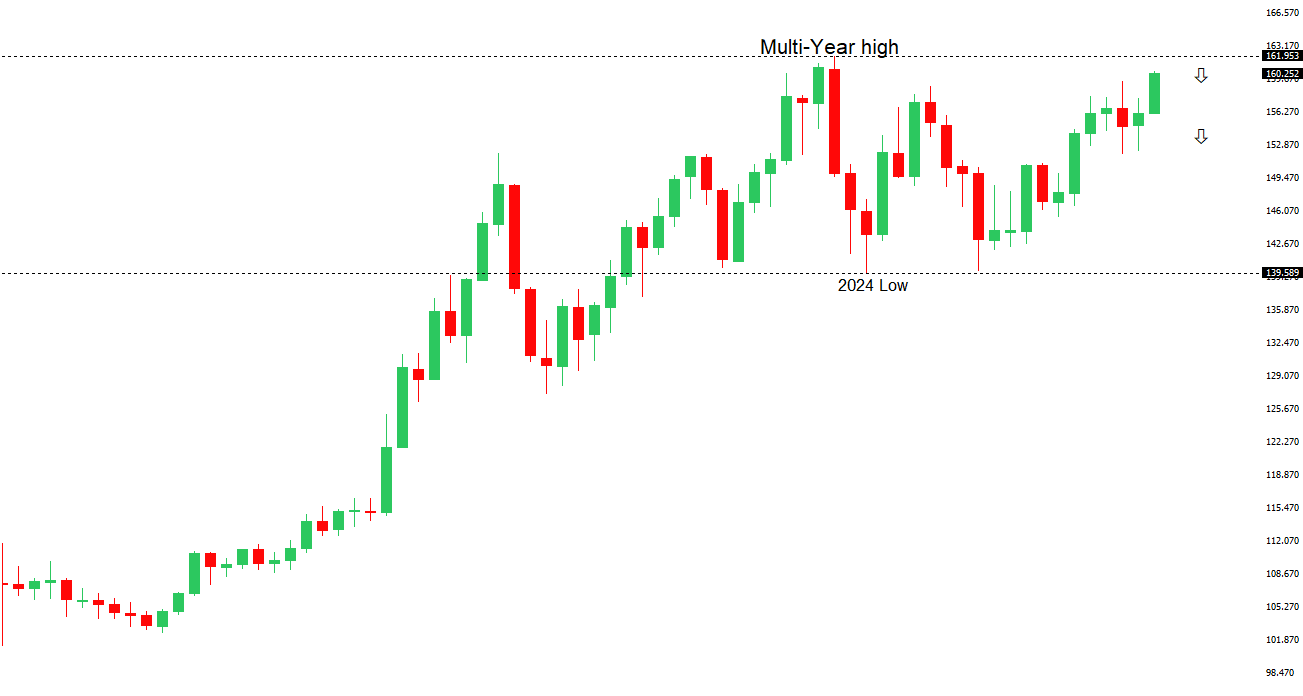 | ||
| R2 161.00 - Figure - Strong R1 160.46 - 30 March/2026 high - Medium S1 158.55 - 25 March low - Medium S2 157.51 - 19 March low - Strong | ||
| USDJPY: fundamental overview | ||
| The Yen has pared earlier gains, with USDJPY still hovering near the 160 level—a zone closely watched for potential intervention by Japanese authorities. Recent Tokyo inflation data showed easing price pressures, with both headline and core CPI remaining below the BoJ’s 2% target, while softer retail sales and industrial production point to weakening domestic demand. Labor market conditions remain relatively stable, but overall, the data suggest a mixed economic backdrop that reduces pressure on the Bank of Japan to tighten policy more aggressively. | ||
| AUDUSD: technical overview | ||
| There are signs of the formation of a longer-term base with the market recovering out from a meaningful longer-term support zone. The latest monthly close back above 0.7000 takes the big picture pressure off the downside and strengthens the case for a bottom, with the focus now on a push towards 0.8000. Setbacks should now be well supported ahead of 0.6700. | ||
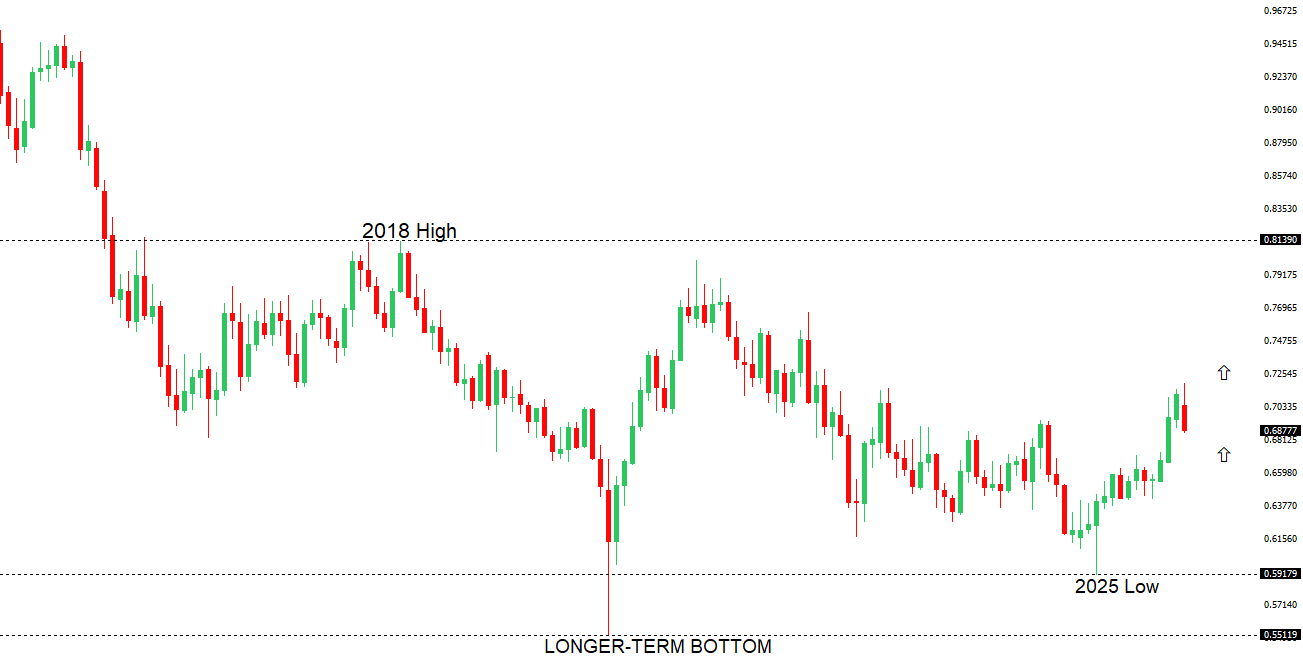 | ||
| R2 0.7188 - 11 March/2026 high - Strong R1 0.7000 - Psychological - Medium S1 0.6833 - 30 March low - Medium S2 0.6767 - 7 January high - Strong | ||
| AUDUSD: fundamental overview | ||
| The Australian dollar remains under pressure near a two-month low, weighed down by heightened geopolitical tensions and a stronger US dollar. Recent RBA minutes highlight a central bank still focused on fighting inflation, delivering another rate hike and signaling more could follow as price pressures—partly driven by energy risks—and tight labor markets persist, even as consumer demand shows signs of strain. Meanwhile, credit data points to resilience, with lending activity stabilizing and picking up modestly despite higher borrowing costs. | ||
| Suggested reading | ||
| Strategy, Bitcoin Whale, Has Stock That Can Defty Gravity, J. Graham, Investors (March 20, 2026) 3 Reasons The Stock Market Can Endure The War, J. Mackintosh, WSJ (March 29, 2026) | ||