


 | ||
| 6th November 2025 | view in browser | ||
| Fed easing, tariff drama capture spotlight | ||
| Markets are drifting into Thursday on a cautious but constructive tide: US equities are catching their breath after a strong run, with the S&P 500 and Dow holding near recent highs while the Nasdaq pulls back on tech profit-taking—broad sentiment remains positive, supported by solid growth and a resilient labor backdrop, but tariff uncertainty and central bank divergence keep traders on edge. | ||
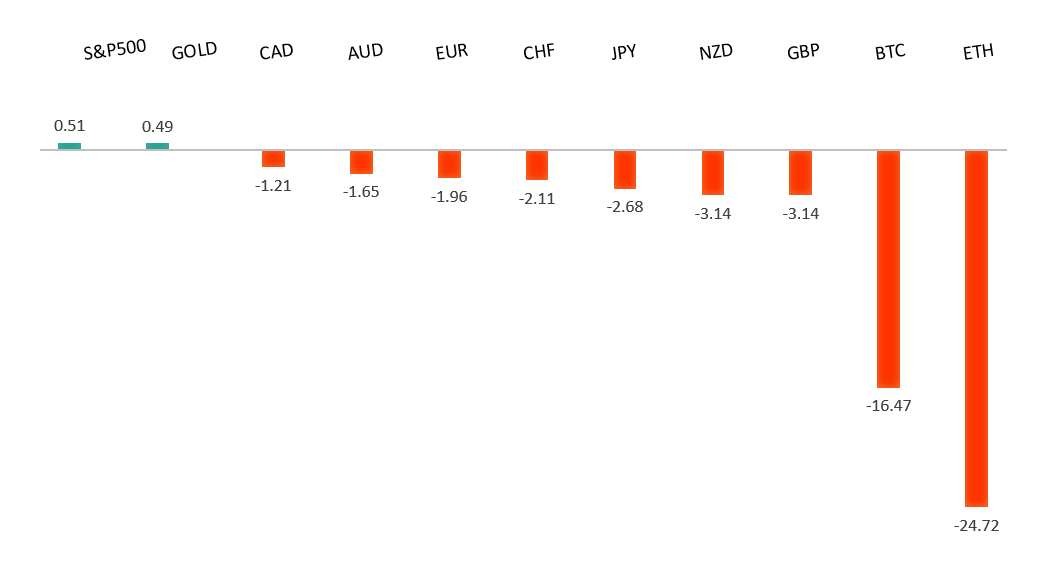
| Performance chart 30day v. USD (%) | ||
 | ||
| Technical & fundamental highlights | ||
| EURUSD: technical overview | ||
| The Euro outlook remains constructive with higher lows sought out on dips in favor of the next major upside extension targeting the 2021 high at 1.2350. Setbacks should be exceptionally well supported ahead of 1.1300. | ||
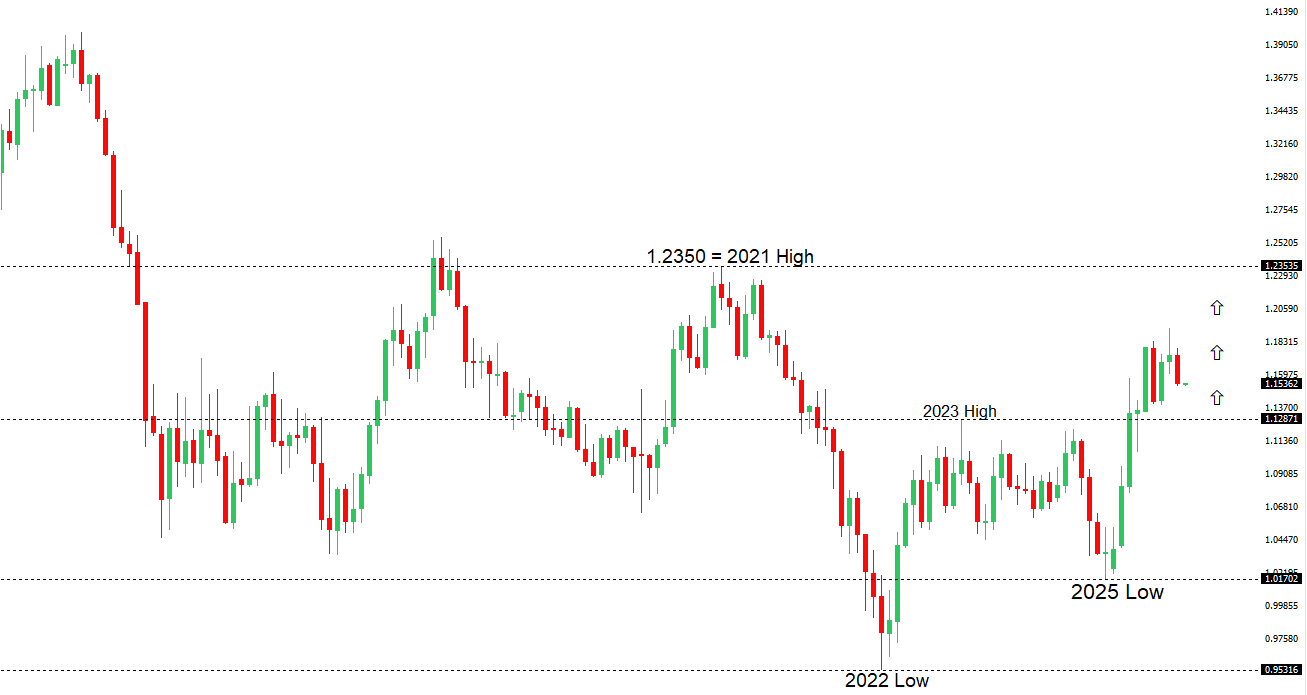 | ||
| R2 1.1729 - 17 October high -Strong R1 1.1669 - 28 October high - Medium S1 1.1469 - 5 November low - Medium S2 1.1392 - 1 August low - Strong | ||
| EURUSD: fundamental overview | ||
| ECB officials see eurozone data matching forecasts, keeping rates on hold until December amid uncertainties, while markets anticipate less ECB-Fed policy divergence after Powell downplayed a December cut, pressuring EURUSD but likely holding above support. German factory orders rose 1.1% and French industrial output gained 0.8% in September—beating expectations and driven by foreign demand despite U.S. tariffs—with analysts expecting ECB rate cuts and fiscal support to aid recovery. Two well known banks note narrowing U.S.-Europe growth gaps and easing trade risks, forecasting ECB rates steady until mid-2026 and EURUSD rising to $1.20 by Q4 2025 and $1.26 by Q3 2026; upcoming data includes eurozone retail sales (+0.2% MoM expected), German industrial production (+3.0% MoM rebound), and construction PMI, signaling modest improvement. | ||
| USDJPY: technical overview | ||
| There are signs of a meaningful top in place after the market put in a multi-year high in 2024. At this point, the door is now open for a deeper setback below the 2024 low at 139.58, exposing a retest of the 2023 low. Rallies should be well capped below 155.00. | ||
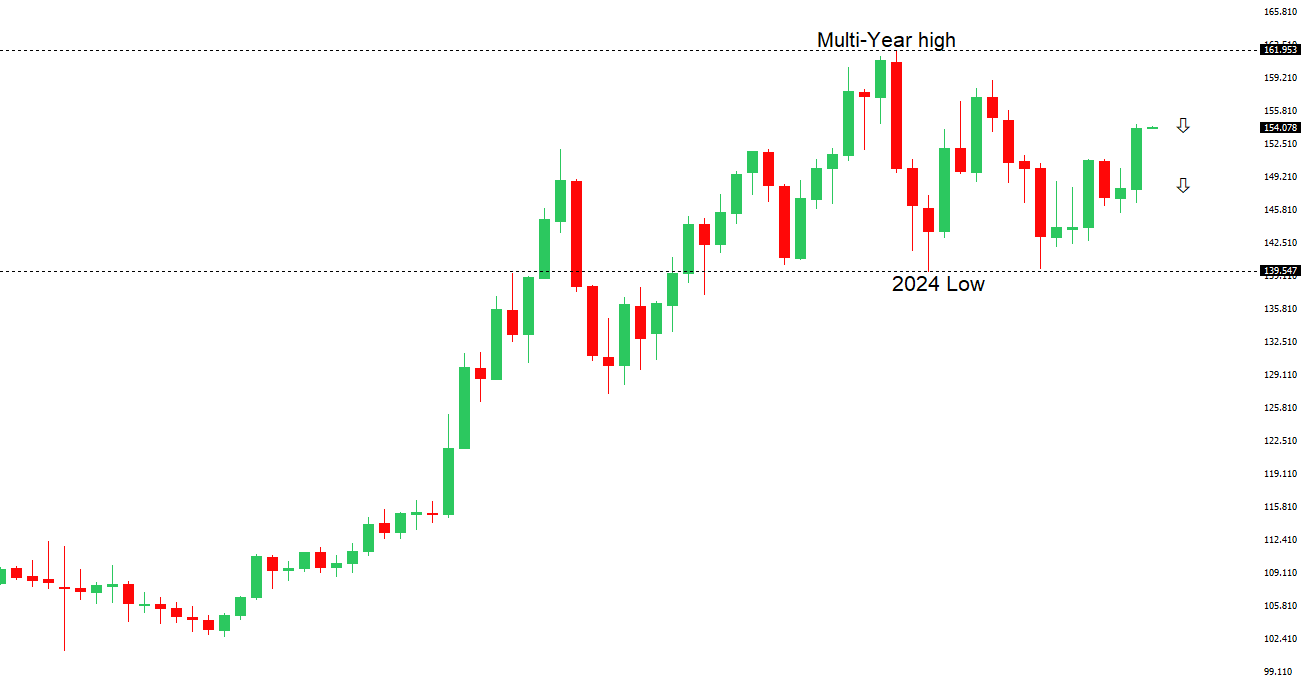 | ||
| R2 154.80 - 12 February high - Strong R1 154.49 - 4 November high - Medium S1 151.54 - 29 October low - Medium S2 149.38 - 17 October low - Strong | ||
| USDJPY: fundamental overview | ||
| PM Sanae Takaichi’s growth strategy, emphasizing cautious monetary tightening and fiscal expansion, signaled prolonged ultra-loose policy and delayed BOJ rate hikes, weakening the yen to new lows as traders sold it for carry trades. Finance officials, including Minister Katayama and Vice Minister Mimura, urgently warned of excessive yen weakness defying fundamentals, ready to intervene if disorderly, while noting reduced long-yen positions amid trade, geopolitical, and fiscal factors; BOJ minutes revealed debate with rates held at 0.5% (7-2 vote), though Governor Ueda eyed a possible December hike if wage momentum builds—September nominal wages rose 1.9% YoY but real earnings fell 1.4% for the ninth month, underscoring waning shunto gains and eroding consumer power. | ||
| AUDUSD: technical overview | ||
| There are signs of the potential formation of a longer-term base with the market trading down into a meaningful longer-term support zone. Only a monthly close below 0.5500 would give reason for rethink. A monthly close back above 0.7000 will take the big picture pressure off the downside and strengthen case for a bottom. | ||
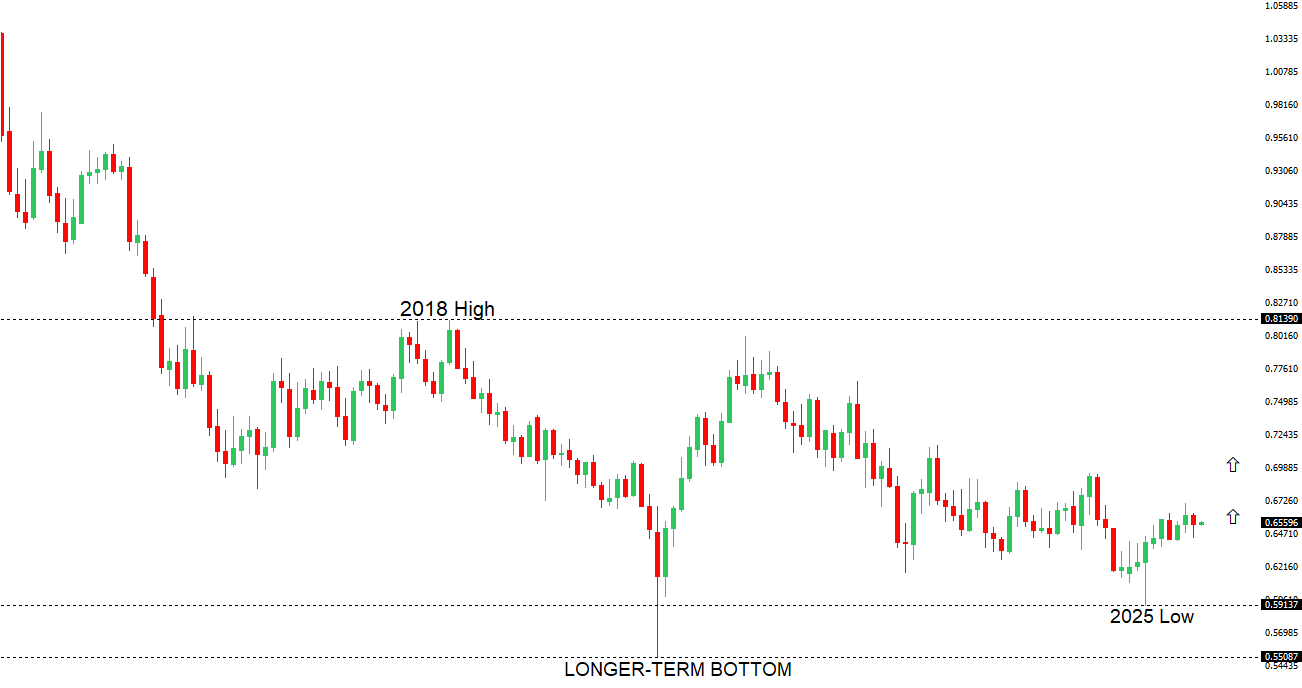 | ||
| R2 0.6629 - 1 October high - Strong R1 0.6618 - 29 October high - Medium S1 0.6458 - 5 November low - Medium S1 0.6440 - 14 October low - Strong | ||
| AUDUSD: fundamental overview | ||
| The RBA’s decision to hold rates at 3.6% and signal no further cuts until mid-2026, amid rising core inflation and a neutral policy stance, supports AUD appreciation into 2026, with short-term dips likely holding and contained. Australia’s stronger GDP growth (1.8–2.3% through 2027) versus the US, combined with a stable job market and rising asset prices, bolsters domestic demand, while improving China-US trade ties boost commodity exports and global risk appetite. Recent data shows a sharp September export rebound (7.9% MoM) driven by higher commodity prices and demand from China, alongside modest import growth, widening the trade surplus. | ||
| Suggested reading | ||
| Finding Investing Heirs to Warren Buffett Will Be Difficult, L. Braham, Barron’s (November 1, 2025) How to Rebalance Your Portfolio in a Lofty Market, A. Arnott, Morningstar (November 4, 2025) | ||