


 | ||
| 20th June 2025 | view in browser | ||
| Geopolitical uncertainty keeps investors cautious | ||
| The Dollar Index hit a weekly high on Thursday amid escalating tensions in the Israel-Iran conflict, with the White House indicating President Trump will decide within two weeks on potential U.S. involvement. | ||
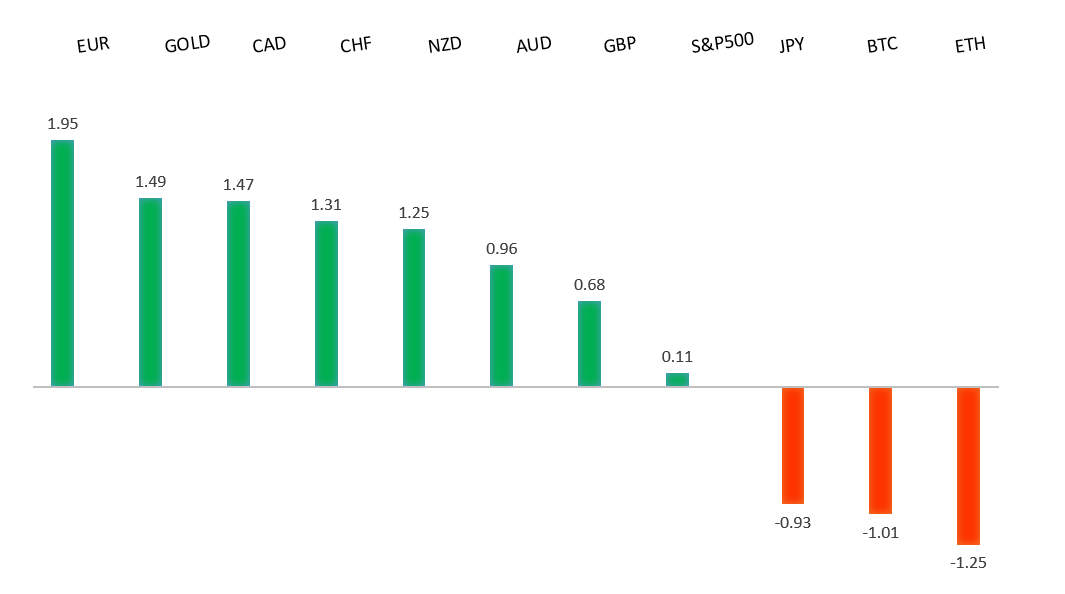
| Performance chart 30day v. USD (%) | ||
 | ||
| Technical & fundamental highlights | ||
| EURUSD: technical overview | ||
| The Euro has finally broken out from a multi-month consolidation off a critical longer-term low. This latest push through the 2023 high lends further support to the case for a meaningful bottom, setting the stage for a bullish structural shift and the next major upside extension targeting the 2021 high at 1.2350. Setbacks should be exceptionally well supported below 1.1000. | ||
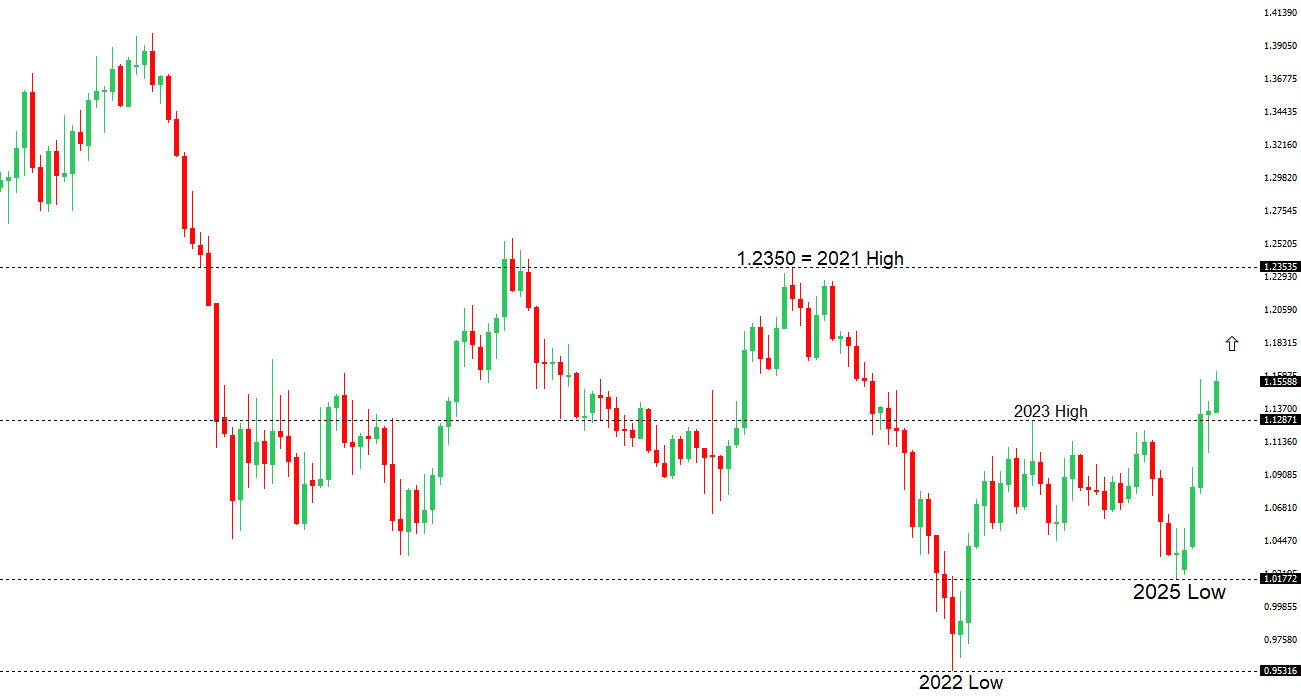 | ||
| R2 1.1632 - 12 June/2025 high - Strong R1 1.1600 - Figure - Medium S1 1.1373 - 10 June low - Medium S2 1.1210 - 29 May low - Strong | ||
| EURUSD: fundamental overview | ||
| EU Economy Commissioner Valdis Dombrovskis reported progress in intensive EU-US trade talks, dismissing speculation of a 10% reciprocal tariff as inaccurate. With a July 9 deadline approaching, failure to reach an agreement could escalate tariffs to 50%, amid existing high tariffs on steel, aluminum, and automobiles causing disruptions for European automakers. Key issues include U.S. demands for changes to EU tech regulations and the EU’s opposition to sector-specific tariffs, with further U.S. investigations into pharmaceuticals and other industries adding complexity. The EU is prepared to impose retaliatory tariffs targeting key U.S. states if talks fail, while IMF’s Kristalina Georgieva sees an opportunity for the euro to grow as a global currency, despite challenges like regulatory fragmentation and high energy costs, which she believes Europe can overcome. | ||
| USDJPY: technical overview | ||
| There are signs of a meaningful top in place after the market put in a multi-year high in 2024. At this point, the door is now open for a deeper setback below the 2024 low at 139.58 over the coming sessions exposing a retest of the 2023 low. Rallies should be well capped below 150.00. | ||
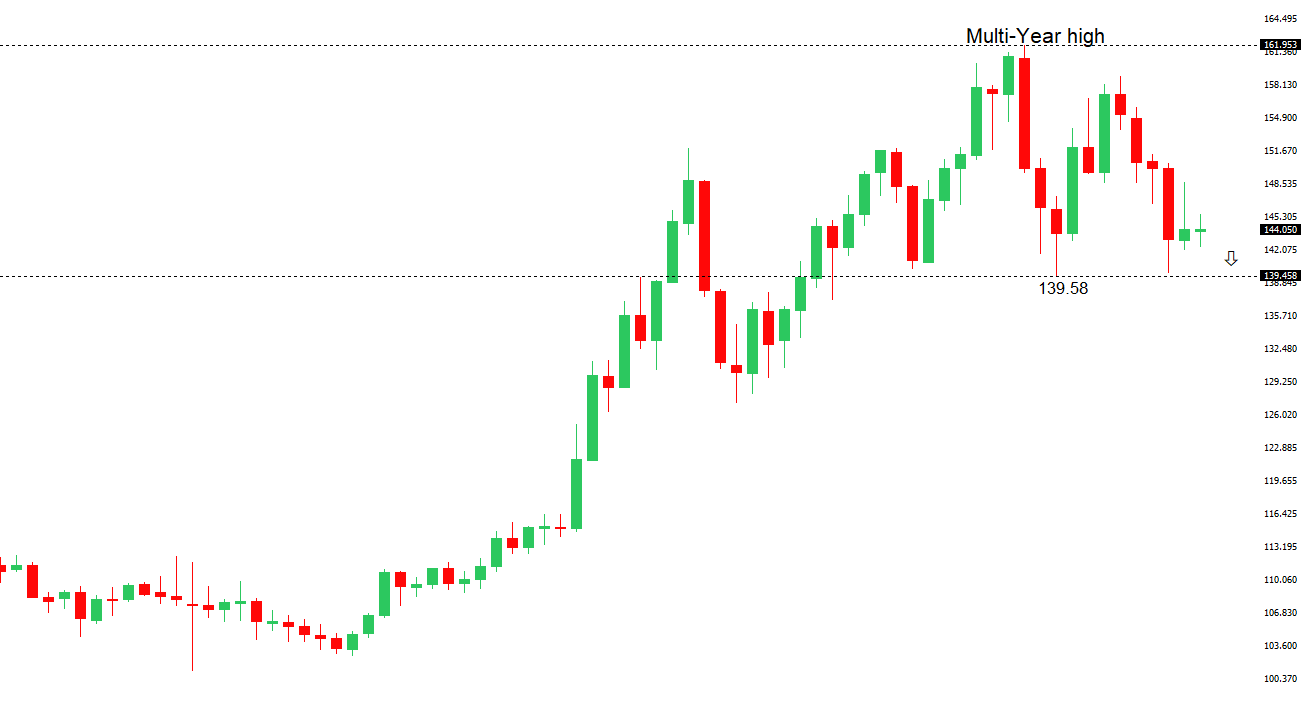 | ||
| R2 148.65 - 12 May high - Medium R1 146.29 - 29 May high - Medium S1 142.11 - 27 May low - Medium S2 141.97 - 29 April low - Medium | ||
| USDJPY: fundamental overview | ||
| Japanese government bond prices rose on Thursday due to strong demand at a five-year bond auction, fueled by expectations that the Ministry of Finance might reduce longer-term debt issuance and fading hopes for a Bank of Japan rate hike. The 10-year JGB yield fell to 1.42%, while Japanese investors may continue seeking higher yields abroad, pressuring the yen. However, May’s core inflation at 3.7%, higher than the expected 3.6%, marked three months of rising prices, driven by service inflation, wage growth, and potential oil price spikes from the Israel-Iran conflict. With U.S.-Japan trade talks and a July 9 tariff deadline approaching, persistent inflation could push the BOJ toward a rate hike in July or September, depending on trade outcomes. | ||
| AUDUSD: technical overview | ||
| There are signs of the potential formation of a longer-term base with the market trading down into a meaningful longer-term support zone. Only a monthly close below 0.5500 would give reason for rethink. A monthly close back above 0.7000 will take the big picture pressure off the downside and strengthen case for a bottom. | ||
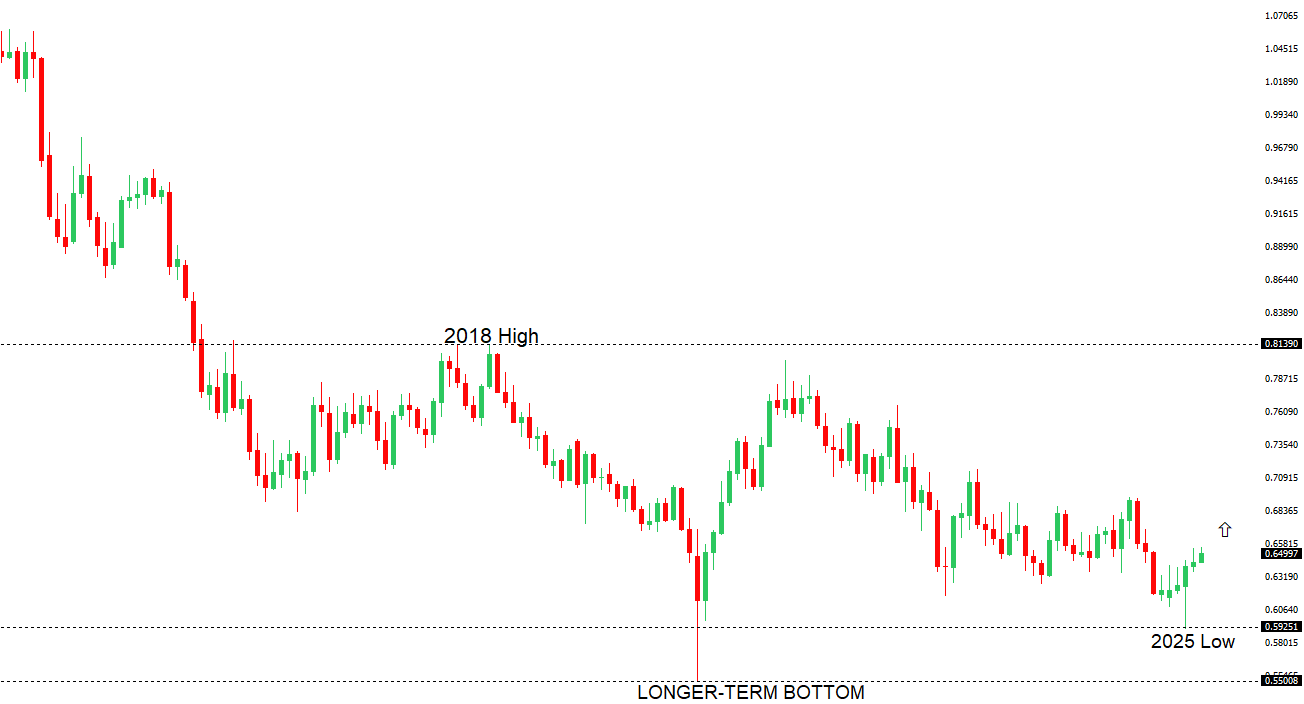 | ||
| R2 0.6550 - 25 November 2024 high - Strong R1 0.6546 - 11 June/2025 high - Medium S1 0.6344 - 24 April low - Medium S1 0.6275 - 14 April low - Strong | ||
| AUDUSD: fundamental overview | ||
| Australia’s labor market remains strong, with May’s unemployment at 4.1% and steady participation, leading most strategists to expect the RBA to pause rate cuts in July, despite markets pricing a 79% chance of another cut. With inflation within target and unemployment below forecasts, the RBA, having already cut rates twice to 3.85%, can afford to wait. One major bank highlights growing foreign interest in Australian bonds amid a global “dedollarization” trend, potentially boosting the Australian Dollar. Meanwhile, Kiwi hit yearly highs against the Buck but pulled back, with near-term movements for both currencies tied to U.S. decisions on the Israel-Iran conflict. | ||
| Suggested reading | ||
| Gut Feelings & Headline Chasing Are Not Good Investing, J. Spittler, RiskHedge (June 16, 2025) Worried About Everything? What To Do To Ease Your Mind, J. Ho, Marketwatch (June 18, 2025) | ||