


 | ||
| 16th June 2025 | view in browser | ||
| Geopolitics driving dollar, oil prices | ||
| The U.S. dollar remains steady but slightly stronger against risk-sensitive currencies as tensions between Israel and Iran escalate, with no signs of de-escalation after four days of strikes. | ||
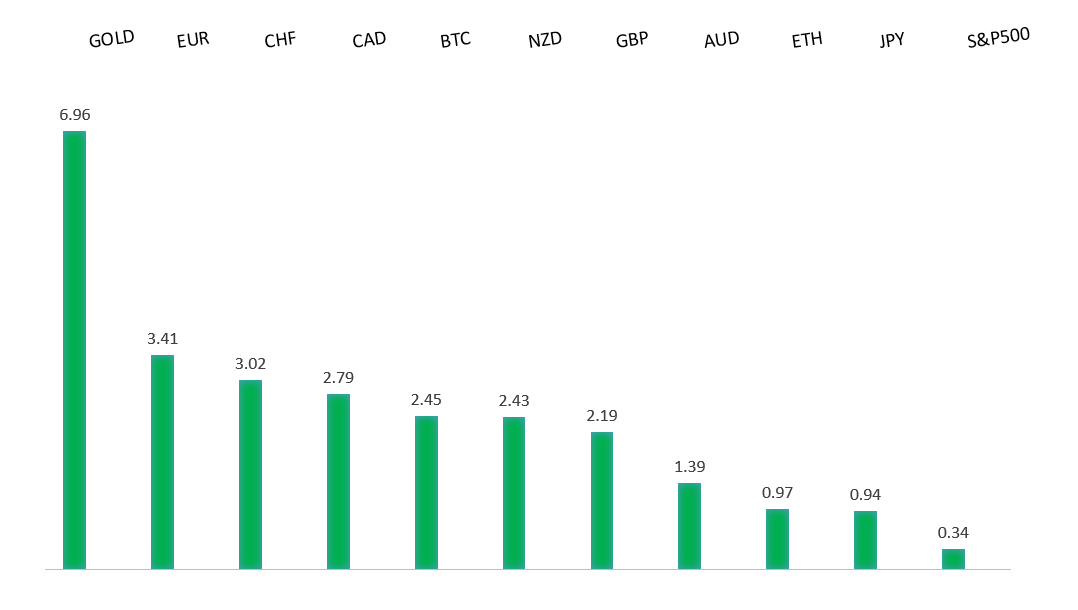
| Performance chart 30day v. USD (%) | ||
 | ||
| Technical & fundamental highlights | ||
| EURUSD: technical overview | ||
| The Euro has finally broken out from a multi-month consolidation off a critical longer-term low. This latest push through the 2023 high lends further support to the case for a meaningful bottom, setting the stage for a bullish structural shift and the next major upside extension targeting the 2021 high at 1.2350. Setbacks should be exceptionally well supported below 1.1000. | ||
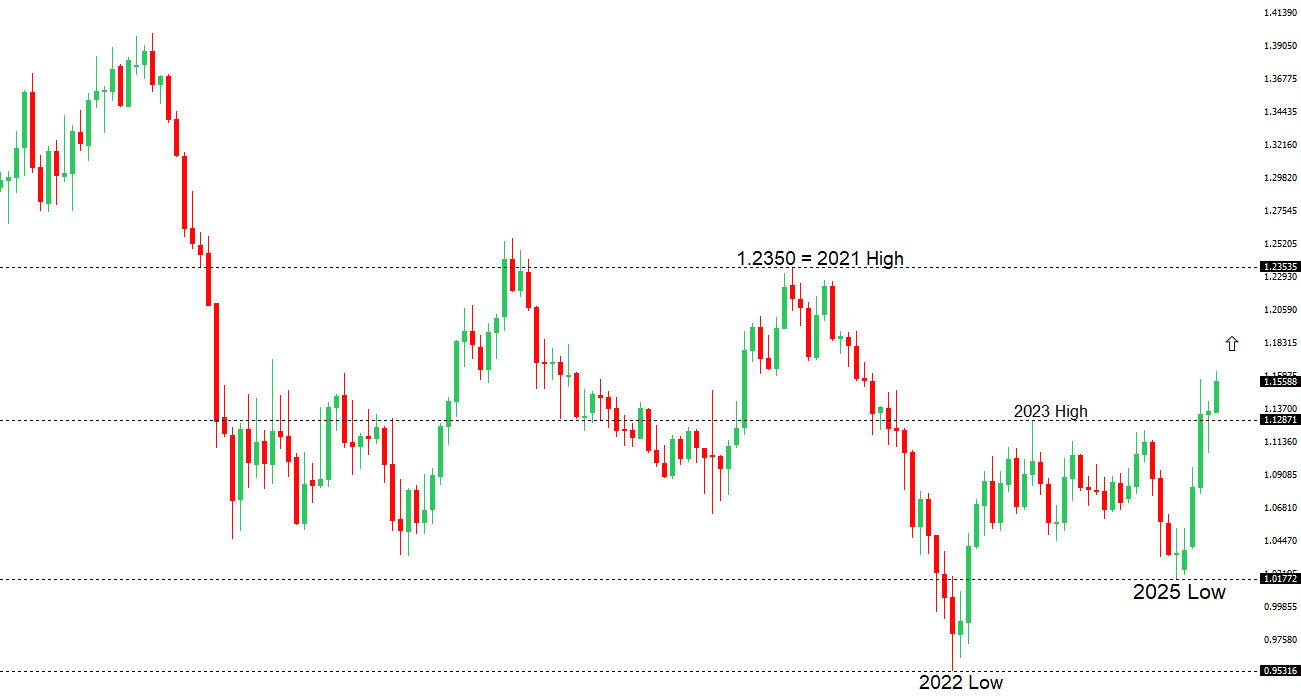 | ||
| R2 1.1632 - 12 June/2025 high - Strong R1 1.1600 - Figure - Medium S1 1.1373 - 10 June low - Medium S2 1.1210 - 29 May low - Strong | ||
| EURUSD: fundamental overview | ||
| Central bank policies are creating mixed effects on currencies. The European Central Bank is pausing its easing measures to assess the impact of potential new US tariffs, while softer US inflation and trade tensions are weakening the dollar, with markets expecting Federal Reserve rate cuts possibly in September. Despite a recent euro boost from these differences, geopolitical concerns are now dominating, with markets anticipating one more 25-basis-point rate cut by the ECB before year-end, most likely in December. | ||
| USDJPY: technical overview | ||
| There are signs of a meaningful top in place after the market put in a multi-year high in 2024. At this point, the door is now open for a deeper setback below the 2024 low at 139.58 over the coming sessions exposing a retest of the 2023 low. Rallies should be well capped below 150.00. | ||
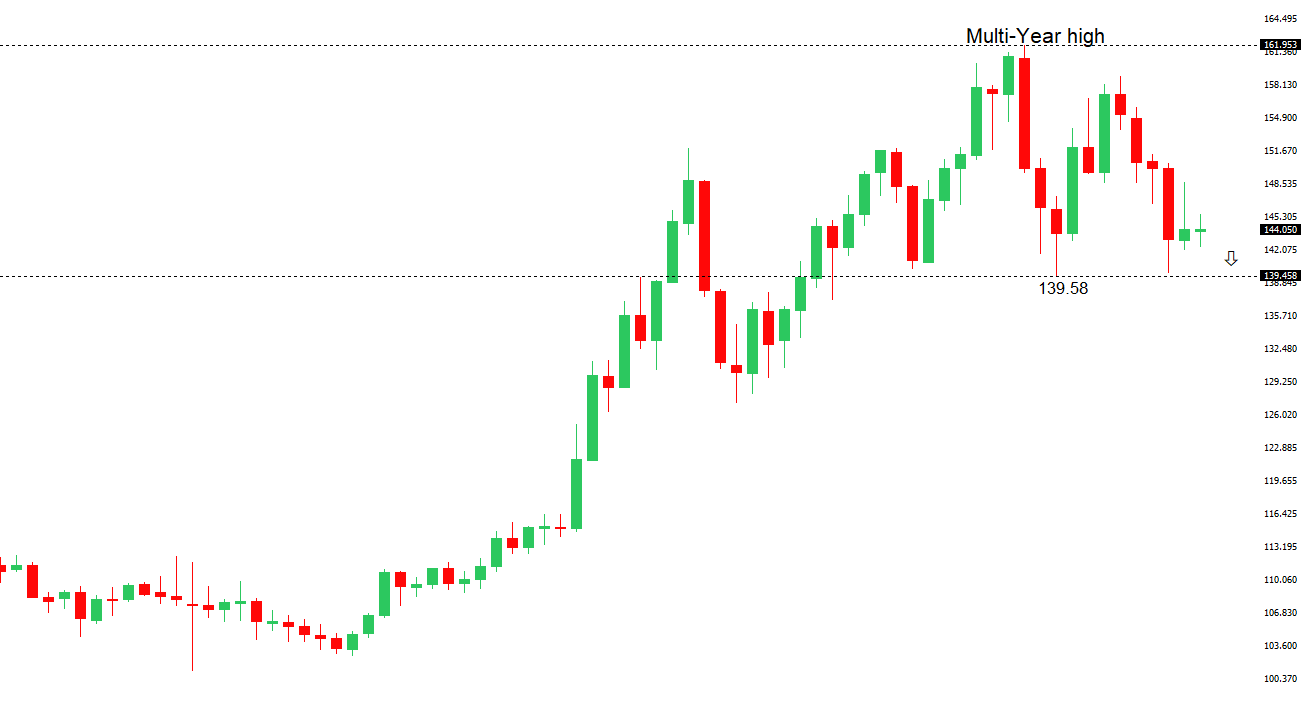 | ||
| R2 148.65 - 12 May high - Medium R1 146.29 - 29 May high - Medium S1 142.11 - 27 May low - Medium S2 141.97 - 29 April low - Medium | ||
| USDJPY: fundamental overview | ||
| The yen weakened as traders favored the dollar amid escalating tensions between Israel and Iran, who attacked each other’s oil and gas facilities, driving up crude prices and complicating global inflation. Japanese bond yields rose to 1.44%, but the Bank of Japan is unlikely to raise rates at its upcoming meeting, with Governor Ueda emphasizing a wait-and-see approach until inflation nears 2%. Despite global uncertainties, Japanese stocks, particularly tech, rose with the Nikkei up 1% and Topix up 0.6%, as investors focused more on BOJ policy than Middle East conflicts. | ||
| AUDUSD: technical overview | ||
| There are signs of the potential formation of a longer-term base with the market trading down into a meaningful longer-term support zone. Only a monthly close below 0.5500 would give reason for rethink. A monthly close back above 0.7000 will take the big picture pressure off the downside and strengthen case for a bottom. | ||
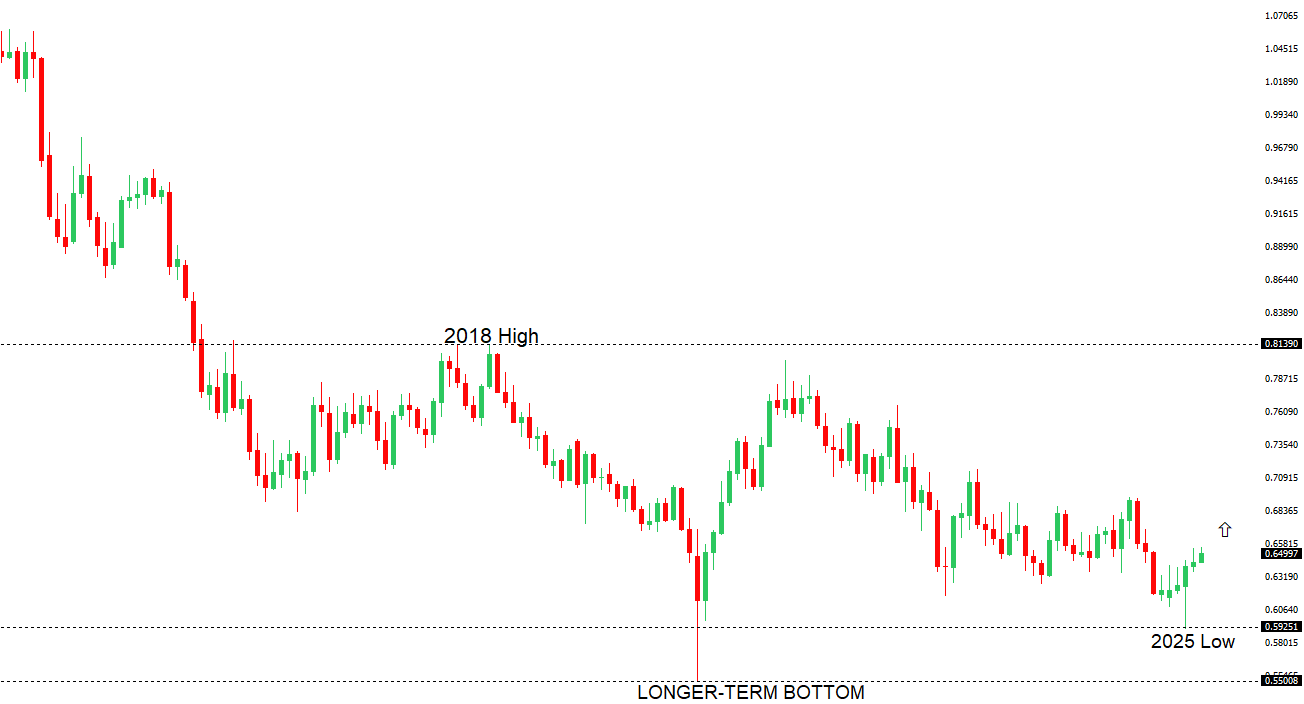 | ||
| R2 0.6550 - 25 November 2024 high - Strong R1 0.6546 - 11 June/2025 high - Medium S1 0.6344 - 24 April low - Medium S1 0.6275 - 14 April low - Strong | ||
| AUDUSD: fundamental overview | ||
| China’s property market is showing slight improvement, with home prices falling 3.5% in May, the smallest decline since April 2024, offering some support for the Australian Dollar due to Australia’s iron ore exports. However, weaker factory output (5.8% growth) and a sharp 10.7% drop in real estate investment limit the Aussie’s gains. Strong retail sales (6.4%) and steady unemployment (5%) in China provide a positive backdrop, but the mixed economic signals keep the Australian Dollar’s rally in check. | ||
| Suggested reading | ||
| A Market Perspective on Israel and Iran’s Conflict, Fisher Investments (June 13, 2025) Reserving Judgment On The Gold Rally, T. Nangle, FT Alphaville (June 12, 2025) | ||