


 | ||
| 7th January 2026 | view in browser | ||
| Global growth cools as central banks tilt dovish | ||
| Global macro sentiment heading into the new day reflects a broad slowdown in growth alongside an increasingly accommodative policy bias across major economies. | ||
| Performance chart 30day v. USD (%) | ||
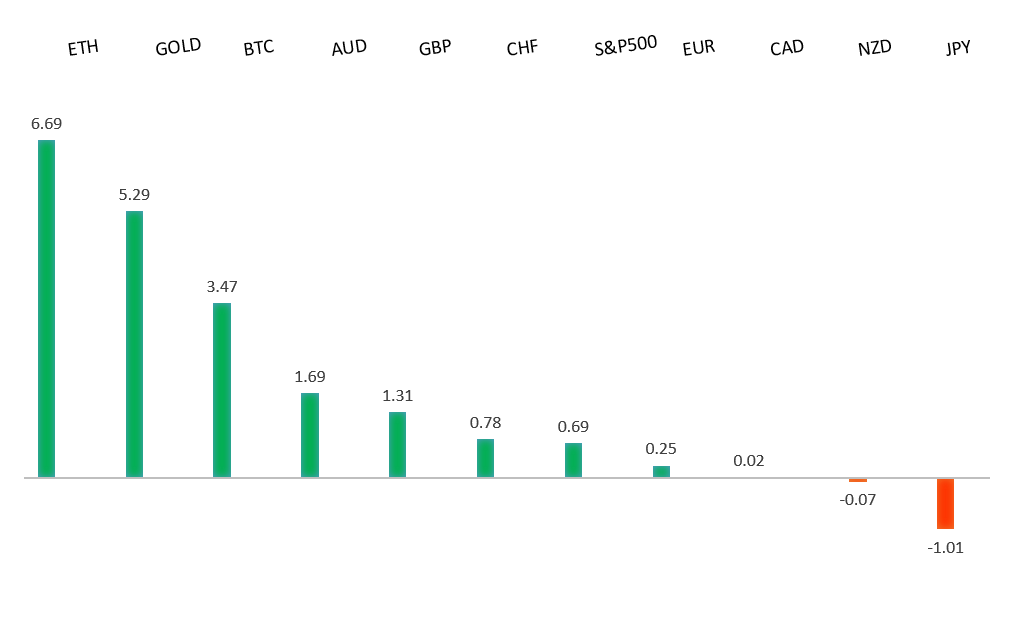 | ||
| Technical & fundamental highlights | ||
| EURUSD: technical overview | ||
| The Euro outlook remains constructive with higher lows sought out on dips in favor of the next major upside extension targeting the 2021 high at 1.2350. Setbacks should be exceptionally well supported ahead of 1.1400. | ||
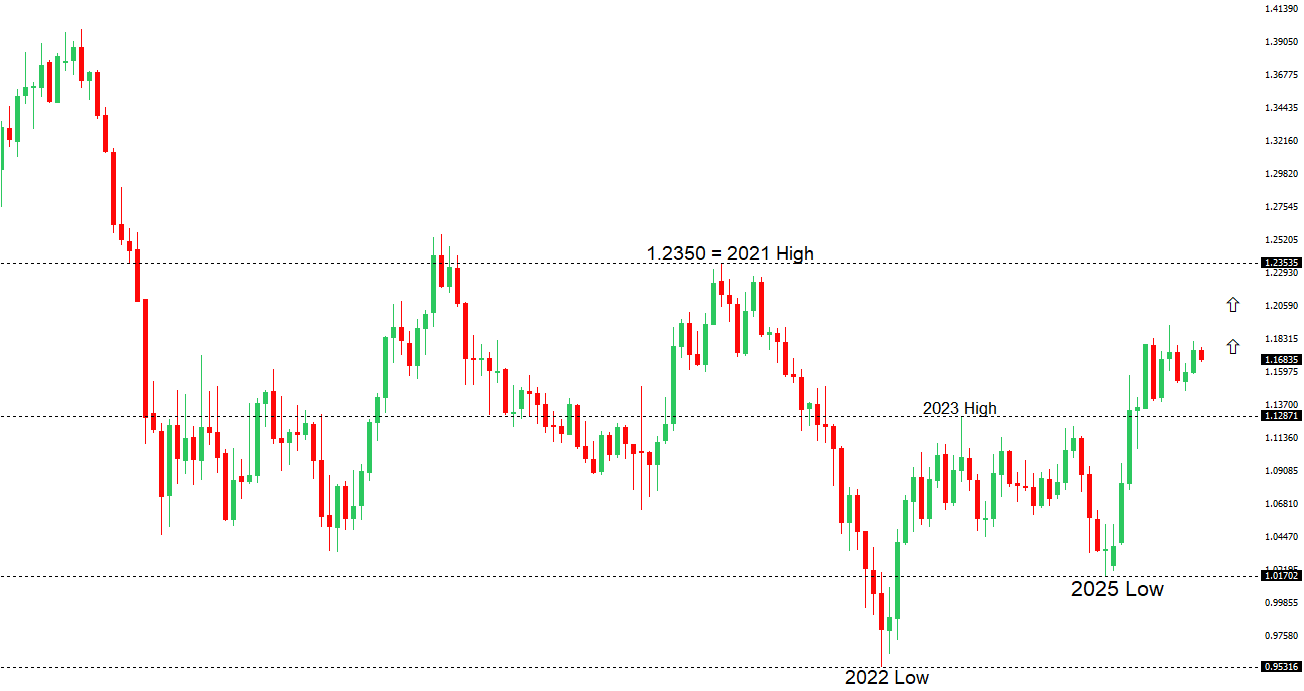 | ||
| R2 1.1919 - 17 September/2025 high -Strong R1 1.1765 - 2 Janaury/2026 high - Medium S1 1.1659 - 5 January /2026 low - Medium S2 1.1615 - 9 December low - Strong | ||
| EURUSD: fundamental overview | ||
| The euro edged up as the dollar softened, with expectations of a stronger euro into 2026 driven by diverging central-bank paths, anticipated Fed rate cuts, and improving Eurozone growth. German inflation data showed faster-than-expected cooling, reinforcing the broader euro-area disinflation trend, though core pressures remain sticky, supporting the ECB’s relatively hawkish stance and resistance to further rate cuts. At the same time, Europe faces mounting political and geopolitical risks—from Germany’s fragile economic outlook and coalition tensions to concerns over US foreign policy moves and unresolved frictions around Ukraine—that add uncertainty to the otherwise improving macro picture. | ||
| USDJPY: technical overview | ||
| There are signs of a meaningful top in place after the market put in a multi-year high in 2024. At this point, rallies should be well capped ahead of 160.00 ahead of a fresh down-leg back towards the 2024 low at 139.58. A break below 154.39 will strengthen the outlook. | ||
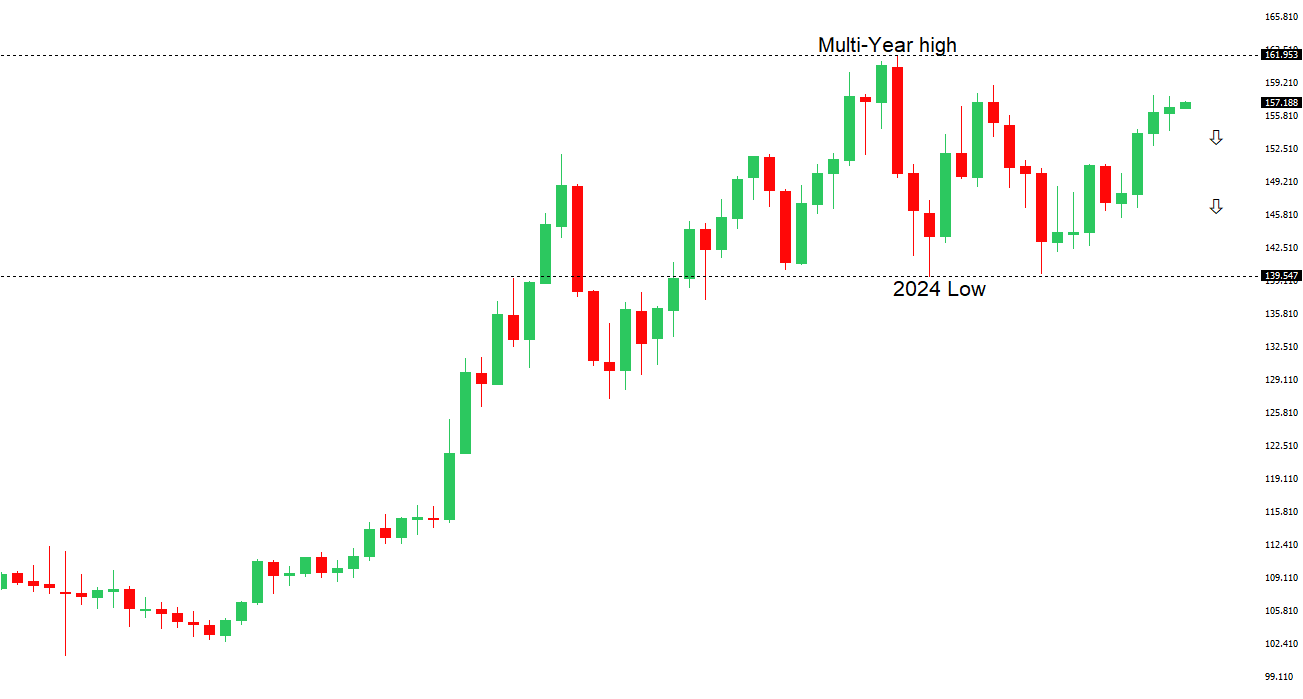 | ||
| R2 157.90 - 20 November/2025 high - Strong R1 157.30 - 5 January /2026 high - Medium S1 155.55 - 24 December low - Medium S2 154.39 - 16 December low - Strong | ||
| USDJPY: fundamental overview | ||
| USDJPY slipped as rising Sino-Japanese geopolitical tensions weighed on sentiment, while slightly weaker-than-expected December PMI data had little market impact. Japanese and U.S. officials remain uneasy about sharp yen weakness beyond 160, with a move above 158 likely to raise the risk of intervention, creating asymmetric risks where upside spikes face policy resistance. Although upcoming wage data are expected to show a temporary slowdown in nominal and real earnings, underlying wage momentum remains solid due to labor shortages and minimum wage hikes, supporting the BOJ’s inflation outlook. Meanwhile, China’s new export restrictions on dual-use items to Japan, though limited for now, add meaningful tail risks of further economic escalation. | ||
| AUDUSD: technical overview | ||
| There are signs of the potential formation of a longer-term base with the market trading down into a meaningful longer-term support zone. Only a monthly close below 0.5500 would give reason for rethink. A monthly close back above 0.7000 will take the big picture pressure off the downside and strengthen case for a bottom. | ||
 | ||
| R2 0.6800 - Figure - Medium R1 0.6767 - 7 January/2026 high - Medium S1 0.6660 - 31 December low - Medium S2 0.6592 - 18 December low - Strong | ||
| AUDUSD: fundamental overview | ||
| The Australian dollar rose about 0.3%, hovering near a 15-month high and marking a fourth straight day of gains after November CPI data showed inflation easing more than expected. While annual inflation slipped to 3.4%, yields stayed elevated and markets continue to price in some chance of near-term RBA rate hikes, though expectations have softened slightly since before the data. In contrast, anticipated ongoing Fed easing through 2026 leaves the RBA’s relatively firmer stance broadly supportive for the AUD against the US Dollar. | ||
| Suggested reading | ||
| 3 Up Years May Seem “Frothy,” But It’s Perfectly Normal, S. McBride, RiskHedge (January 5, 2026) I Don’t Know What Will Happen. No One Does, J. Calhoun, Alhambra (January 4, 2026) | ||