


 | ||
| 17th March 2026 | view in browser | ||
| Rate Hikes, War Risks, and Fragile Markets | ||
| Markets open cautiously as central bank tightening meets rising geopolitical tensions, keeping risk sentiment fragile. | ||
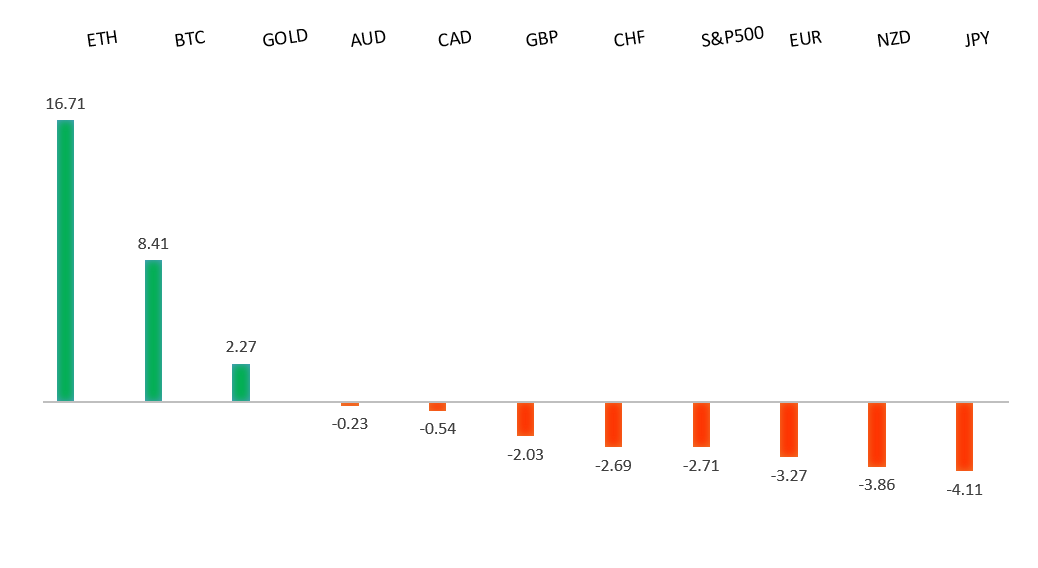
| Performance chart 30day v. USD (%) | ||
 | ||
| Technical & fundamental highlights | ||
| EURUSD: technical overview | ||
| The Euro outlook remains constructive with higher lows sought out on dips in favor of the next major upside extension targeting the 2021 high at 1.2350. Setbacks should be exceptionally well supported ahead of 1.1300. | ||
 | ||
| R2 1.1668 - 10 March high - Strong R1 1.1530 - 13 March high - Medium S1 1.1411 - 13 March/2026 low - Medium S2 1.1400 - Figure - Strong | ||
| EURUSD: fundamental overview | ||
| The euro remains under pressure from rising imported energy costs and continued safe-haven support for the dollar. While higher oil and gas prices may lift near-term inflation, they also risk slowing growth, leaving the ECB cautious—likely leaning on stronger communication rather than immediate policy tightening. As a result, any support from ECB rhetoric may limit downside but is unlikely to drive sustained euro strength, especially with Europe more exposed to elevated energy prices, keeping the near-term bias tilted to the downside. | ||
| USDJPY: technical overview | ||
| There are signs of the formation of a meaningful top after the market put in a multi-year high in 2024. At this point, rallies should be well capped above 160.00 in favor of a fresh down-leg back towards the 2024 low at 139.58. Only a monthly close above 160.00 negates. | ||
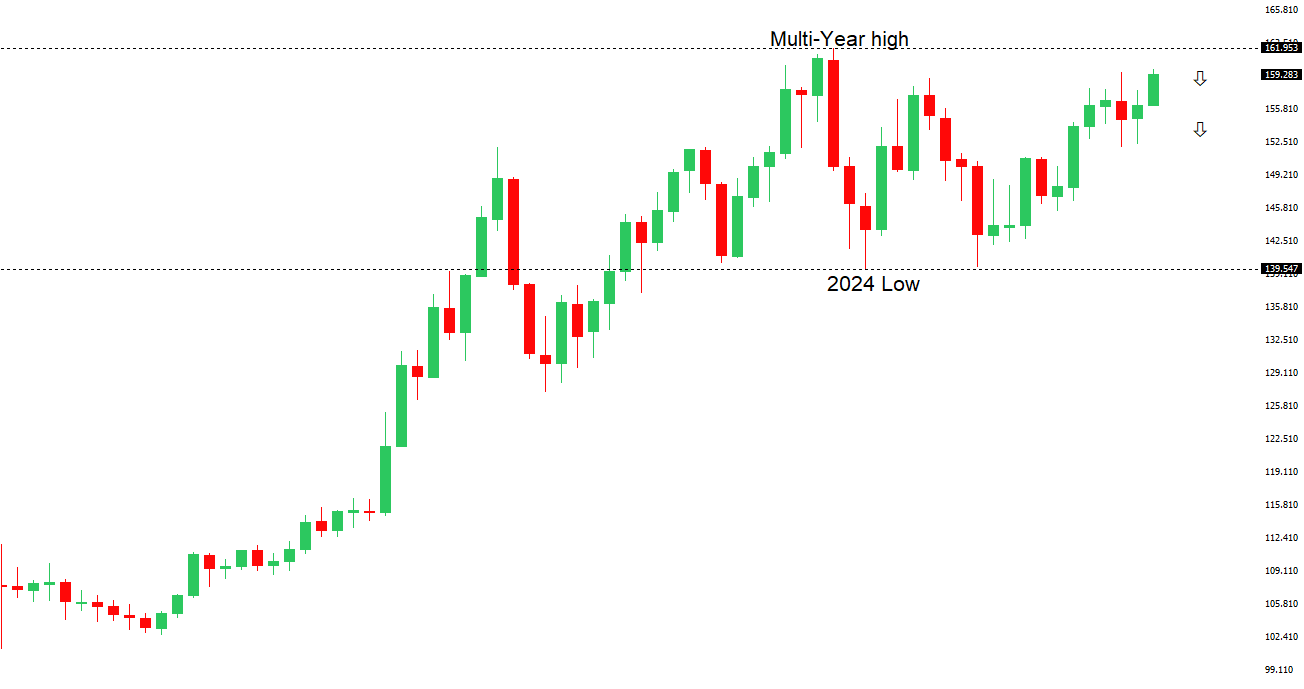 | ||
| R2 160.00 - Psychological - Strong R1 159.75 - 13 March/2026 high - Medium S1 157.27 - 10 March low - Medium S2 156.45 - 5 March low - Strong | ||
| USDJPY: fundamental overview | ||
| The yen remains well offered with USDJPY still sitting just below the key 160 level that has previously raised intervention concerns. The yen remains under pressure as its safe-haven appeal is diluted by a strong dollar, rising oil prices that hurt Japan’s trade balance, and a persistent yield disadvantage, with the BOJ expected to stay on hold for now. While official warnings may slow the move, they are unlikely to reverse the trend without a broader dollar decline or lower oil prices, leaving the yen vulnerable in the near term despite stretched valuations. | ||
| AUDUSD: technical overview | ||
| There are signs of the formation of a longer-term base with the market recovering out from a meaningful longer-term support zone. The latest monthly close back above 0.7000 takes the big picture pressure off the downside and strengthens the case for a bottom, with the focus now on a push towards 0.8000. Setbacks should now be well supported ahead of 0.6700. | ||
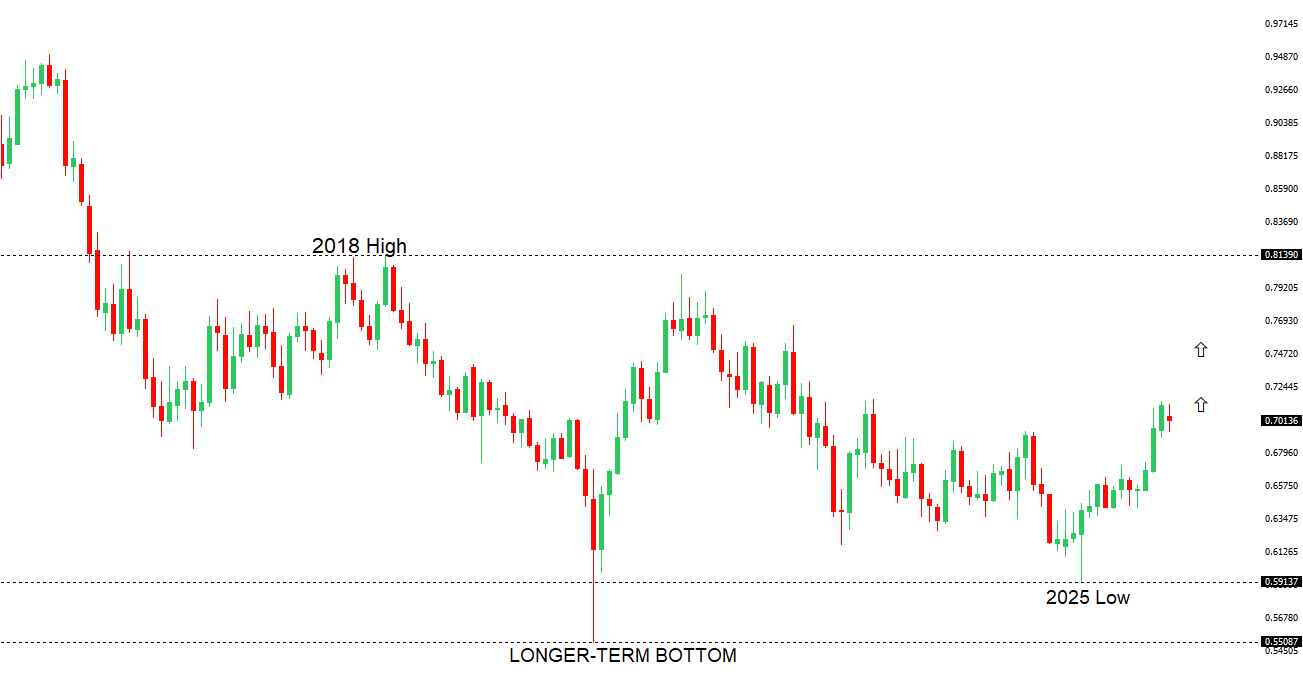 | ||
| R2 0.7200 - Figure - Medium R1 0.7188 - 11 March/2026 high - Medium S1 0.6944 - 3 March low - Medium S2 0.6897 - 6 February low - Strong | ||
| AUDUSD: fundamental overview | ||
| The Australian dollar remains well supported by stronger commodity prices and a relatively hawkish central bank. The RBA raised rates by 25bps to 4.10%, as expected, highlighting persistent inflation and risks tied to Middle East uncertainty, with policymakers signaling inflation could stay elevated and risks skewed to the upside. A narrow 5–4 vote reflects internal division, but the move reinforces a renewed tightening bias and commitment to price stability. While this supports near-term AUD resilience, gains may be limited if a prolonged oil shock weakens global demand. | ||
| Suggested reading | ||
| Kevin Warsh Will Be Just Like Powell, Yellen, Bernanke, and…, J. Tamny, Forbes (March 15, 2026) How Investors Can Survive So-Called AI Doom Loop, S. Longenecker, Marketwise (March 11, 2026) | ||