


 | ||
| 13th June 2025 | view in browser | ||
| Israel-Iran clash triggers investor panic | ||
| A surprise Israeli airstrike on Iranian nuclear facilities has rattled global markets, sending global equities lower as investors flock to safe-haven assets. Amid this turmoil, attention is also on the upcoming University of Michigan consumer sentiment report. | ||
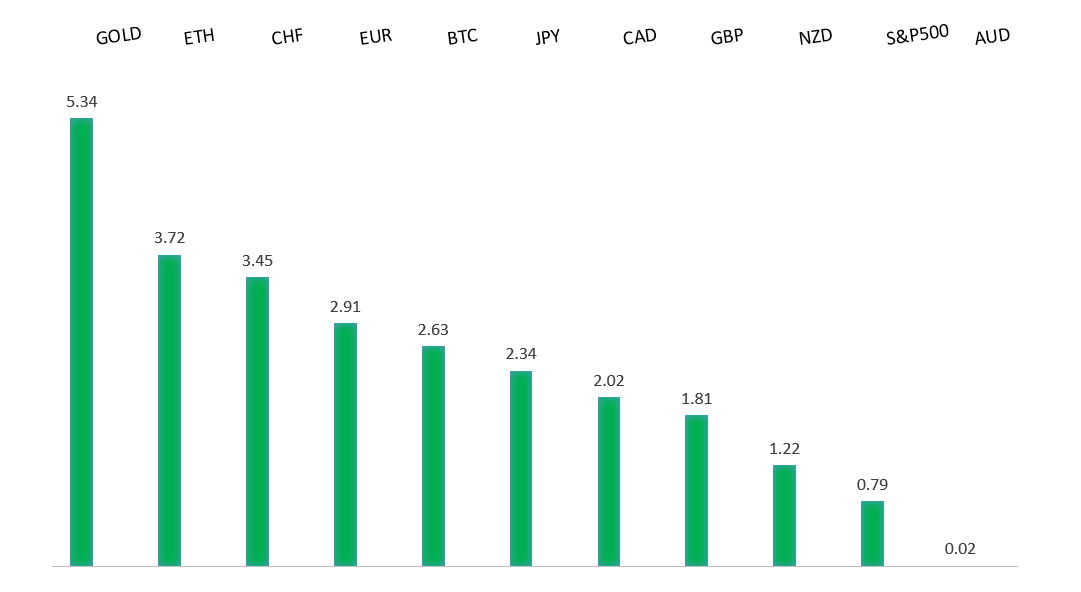
| Performance chart 30day v. USD (%) | ||
 | ||
| Technical & fundamental highlights | ||
| EURUSD: technical overview | ||
| The Euro has finally broken out from a multi-month consolidation off a critical longer-term low. This latest push through the 2023 high lends further support to the case for a meaningful bottom, setting the stage for a bullish structural shift and the next major upside extension targeting the 2021 high at 1.2350. Setbacks should be exceptionally well supported below 1.1000. | ||
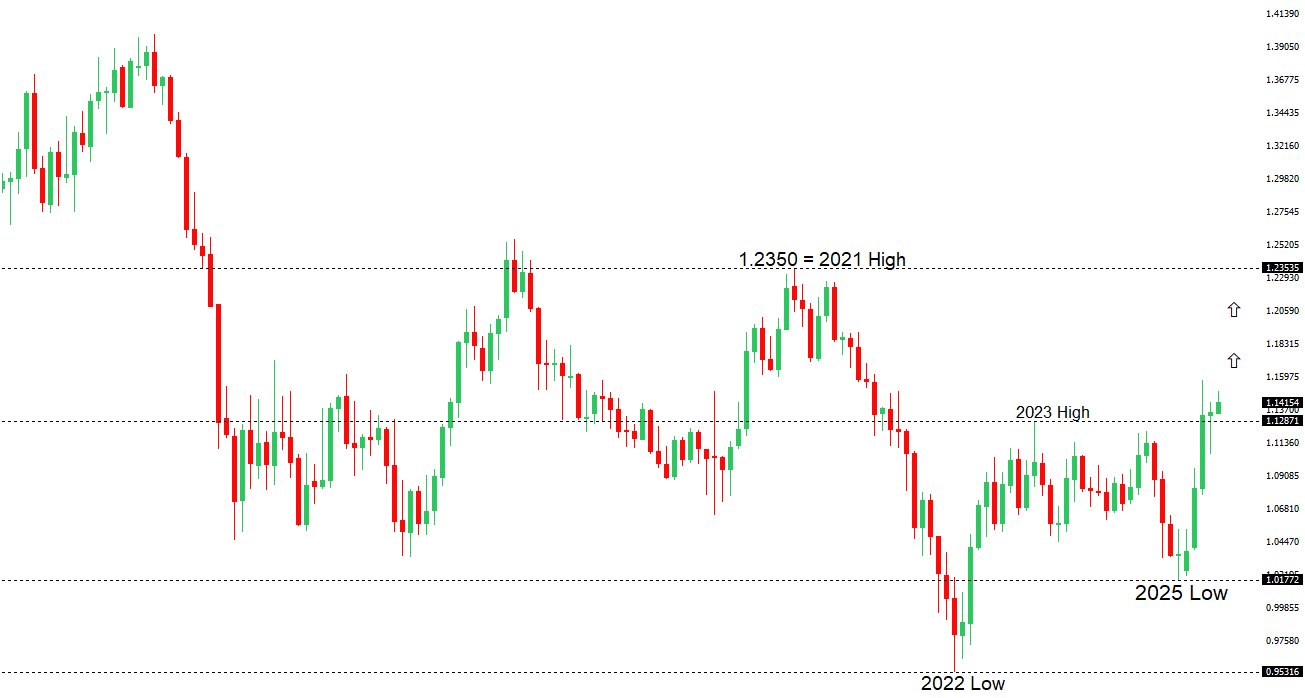 | ||
| R2 1.1632 - 12 June/2025 high - Strong R1 1.1600 - Figure - Medium S1 1.1373 - 10 June low - Medium S2 1.1210 - 29 May low - Strong | ||
| EURUSD: fundamental overview | ||
| The euro paused its four-day rise, shifting to retreat mode as Middle East tensions boosted demand for the US dollar. However, the dollar’s gains may be capped by President Trump’s expanded steel tariffs on household appliances and lower-than-expected CPI and PPI reports, which support expectations for Federal Reserve rate cuts. Investors are now focused on upcoming CPI data from Europe, an ECB speech, and the Michigan Consumer Sentiment report for further economic insights. | ||
| USDJPY: technical overview | ||
| There are signs of a meaningful top in place after the market put in a multi-year high in 2024. At this point, the door is now open for a deeper setback below the 2024 low at 139.58 over the coming sessions exposing a retest of the 2023 low. Rallies should be well capped below 150.00. | ||
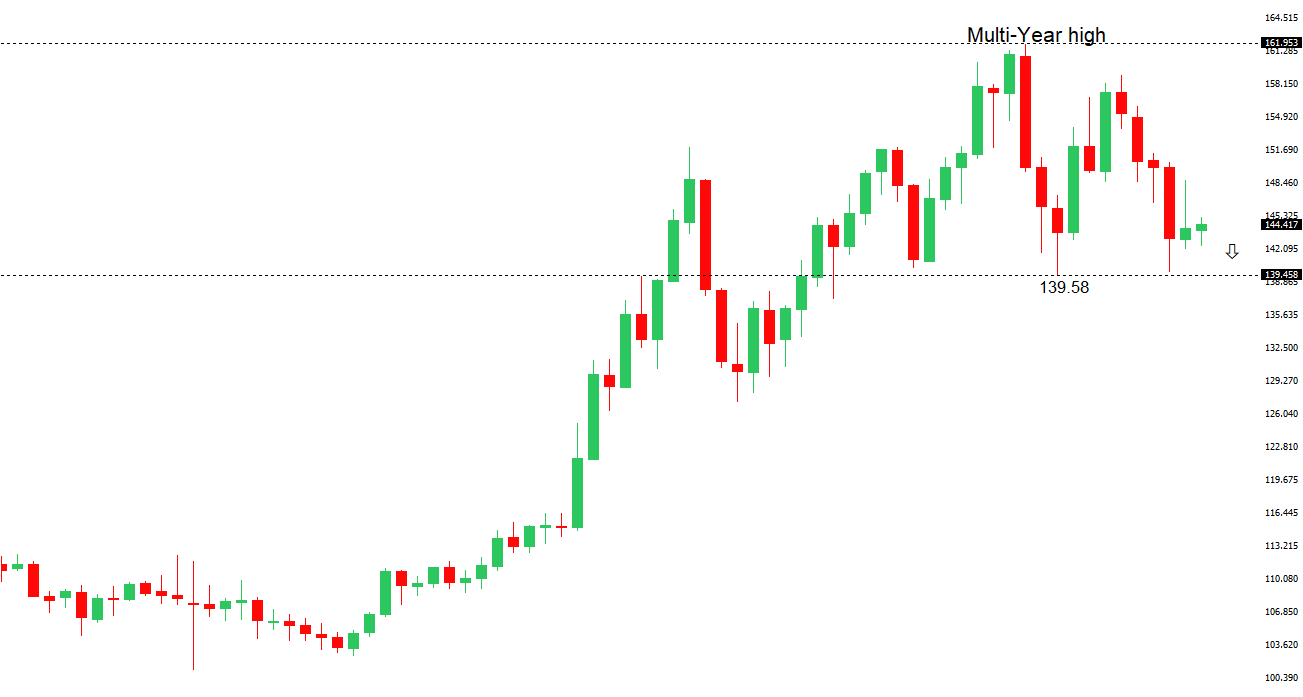 | ||
| R2 148.65 - 12 May high - Medium R1 146.29 - 29 May high - Medium S1 142.11 - 27 May low - Medium S2 141.97 - 29 April low - Medium | ||
| USDJPY: fundamental overview | ||
| The yen initially surged against the dollar following news of an Israeli attack, with its safe-haven status bolstered by geopolitical tensions and potential Iranian retaliation. President Trump’s tariff threats add to market uncertainty, further supporting the yen and driving Japanese bond yields lower, with the 10-year yield hitting 1.4%. Japanese stock indices, Nikkei 225 and Topix, fell over 1%, reflecting broader market unease, while BOJ Governor Ueda maintained a hawkish stance, signaling potential rate hikes if inflation neared 2%. | ||
| AUDUSD: technical overview | ||
| There are signs of the potential formation of a longer-term base with the market trading down into a meaningful longer-term support zone. Only a monthly close below 0.5500 would give reason for rethink. A monthly close back above 0.7000 will take the big picture pressure off the downside and strengthen case for a bottom. | ||
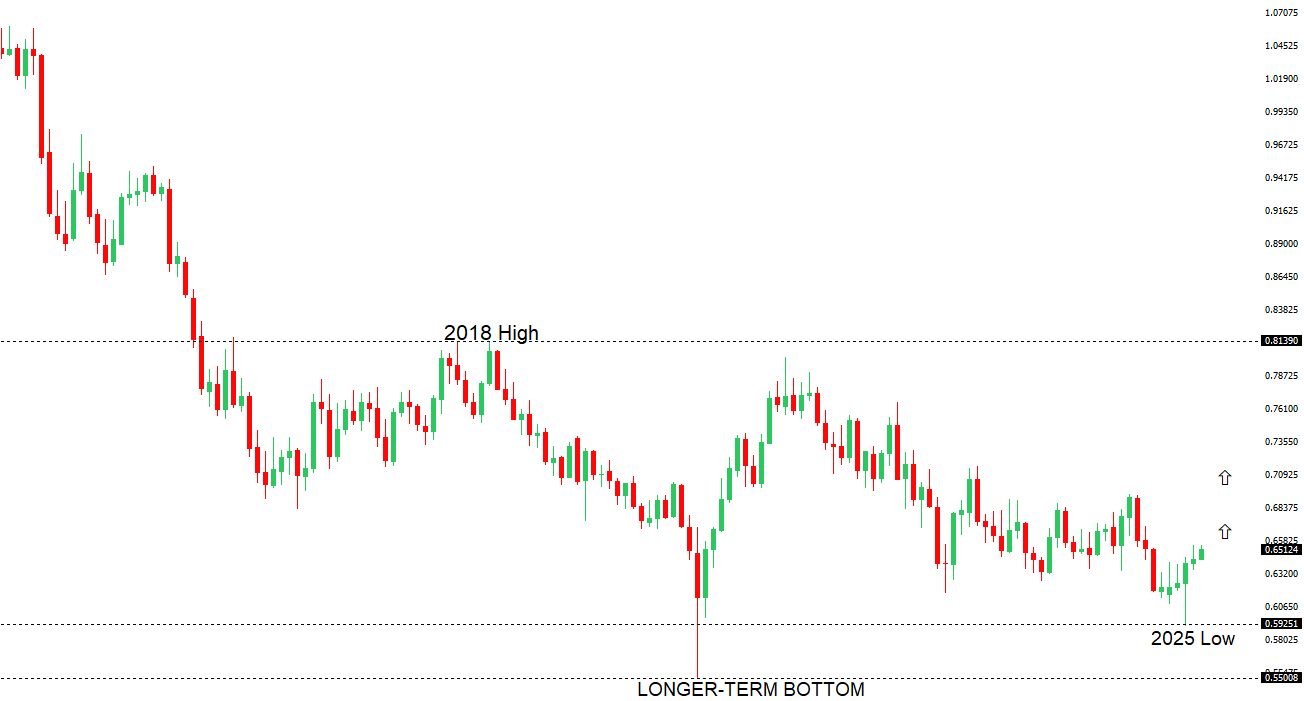 | ||
| R2 0.6550 - 25 November 2024 high - Strong R1 0.6546 - 11 June/2025 high - Medium S1 0.6344 - 24 April low - Medium S1 0.6275 - 14 April low - Strong | ||
| AUDUSD: fundamental overview | ||
| Financial markets in Australia faced significant turmoil today following Israel’s unexpected attack on Iranian nuclear sites, prompting a widespread sell-off of risky assets. The Australian dollar plummeted, erasing recent gains, as fears of Iranian retaliation and escalating Middle East tensions gripped investors. Adding to the uncertainty, renewed U.S. tariff threats under Trump, including a proposed 50% steel duty hike by June 23, further rattled Australia’s export-driven economy. In response, investors sought safety, driving 10-year ACGB yields down to the lowest levels since May. Compounding the unease, weak GDP data and speculation of an 80% chance of an RBA rate cut next month, potentially lowering rates to 3.10% by year-end, signal a rapidly cooling economy. | ||
| Suggested reading | ||
| The Resurgence of Do It Yourself Economics, I. Murray, The Daily Economy (June 12, 2025) Check Your Political Brain When Putting Your Money To Work, J. Hough, Barron’s (June 6, 2025) | ||