


 | ||
| 19th January 2026 | view in browser | ||
| Macro tone turns cautious | ||
| With US markets closed and the Fed in blackout, global macro sentiment leans cautious, with Asia data highlighting uneven growth, rising policy uncertainty, and renewed inflation risks shaping an increasingly complex outlook for markets. | ||
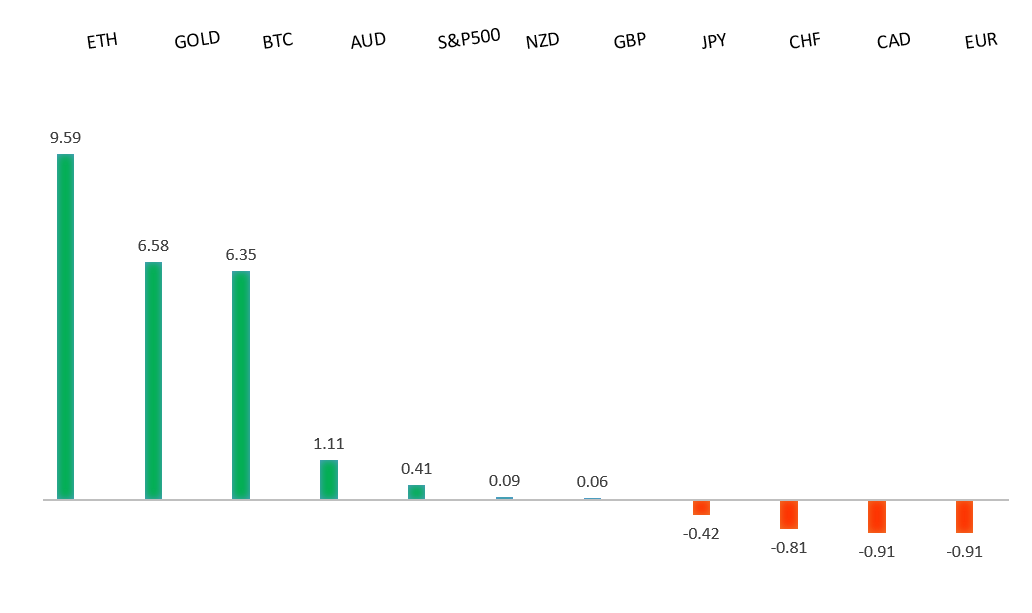
| Performance chart 30day v. USD (%) | ||
 | ||
| Technical & fundamental highlights | ||
| EURUSD: technical overview | ||
| The Euro outlook remains constructive with higher lows sought out on dips in favor of the next major upside extension targeting the 2021 high at 1.2350. Setbacks should be exceptionally well supported ahead of 1.1400. | ||
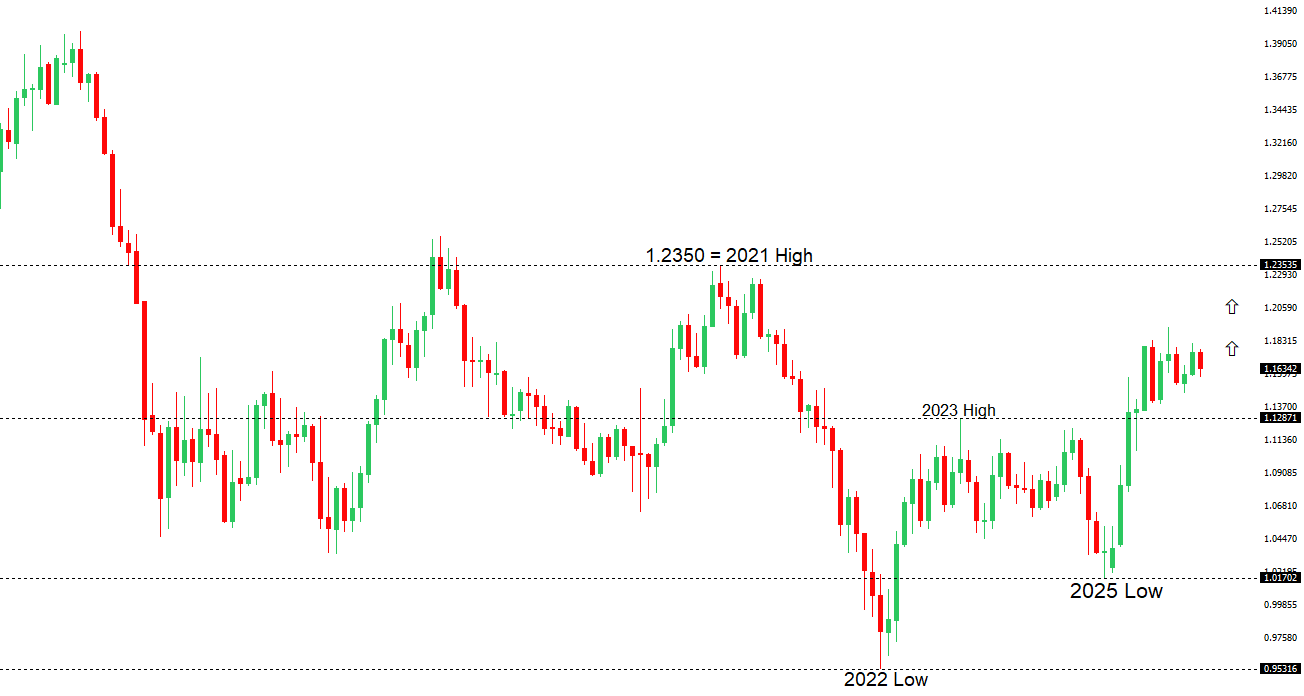 | ||
| R2 1.1808 - 24 December high -Strong R1 1.1699 - 12 Janaury high - Medium S1 1.1577 - 19 January /2026 low - Medium S2 1.1530 - 7 November low - Medium | ||
| EURUSD: fundamental overview | ||
| Europe is facing fresh tensions with the Trump administration after Trump announced a 10% tariff from Feb. 1 on countries backing Greenland against US pressure, with a threat to raise it to 25% unless a deal is reached to purchase the territory. Rather than weakening the euro, the news has helped spark a rebound, as markets see the dispute as a potential catalyst for stronger European political unity. One European bank warns the standoff could strain the Western alliance, while France is pushing for a coordinated EU response. Meanwhile, investors are watching key eurozone data this week, including Germany’s ZEW survey and January PMI readings. | ||
| USDJPY: technical overview | ||
| There are signs of a meaningful top in place after the market put in a multi-year high in 2024. At this point, rallies should be well capped ahead of 160.00 ahead of a fresh down-leg back towards the 2024 low at 139.58. A break below 154.39 will strengthen the outlook. | ||
 | ||
| R2 160.00 - Psychological - Strong R1 159.46 - 14 January /2026 high - Medium S1 157.42 - 19 January low - Medium S2 156.11 - 5 January/2026 low - Strong | ||
| USDJPY: fundamental overview | ||
| The pair has dipped on profit taking and heightened sensitivity to intervention rhetoric, with both Japanese officials and US Treasury Secretary Bessent stepping up verbal warnings. The BoJ is expected to hold rates at 0.75% this week, with markets watching for any hints on the timing of the next hike, still seen only in the second half of the year, even as yen weakness is increasingly viewed as a trigger for earlier tightening rather than a reason to delay. For now, 160.00 remains a key near-term line in the sand, with political and fiscal risks offsetting any support from potential BoJ hawkish signals, while upcoming bond operations, auctions and inflation data will be closely watched. | ||
| AUDUSD: technical overview | ||
| There are signs of the potential formation of a longer-term base with the market trading down into a meaningful longer-term support zone. Only a monthly close below 0.5500 would give reason for rethink. A monthly close back above 0.7000 will take the big picture pressure off the downside and strengthen case for a bottom. | ||
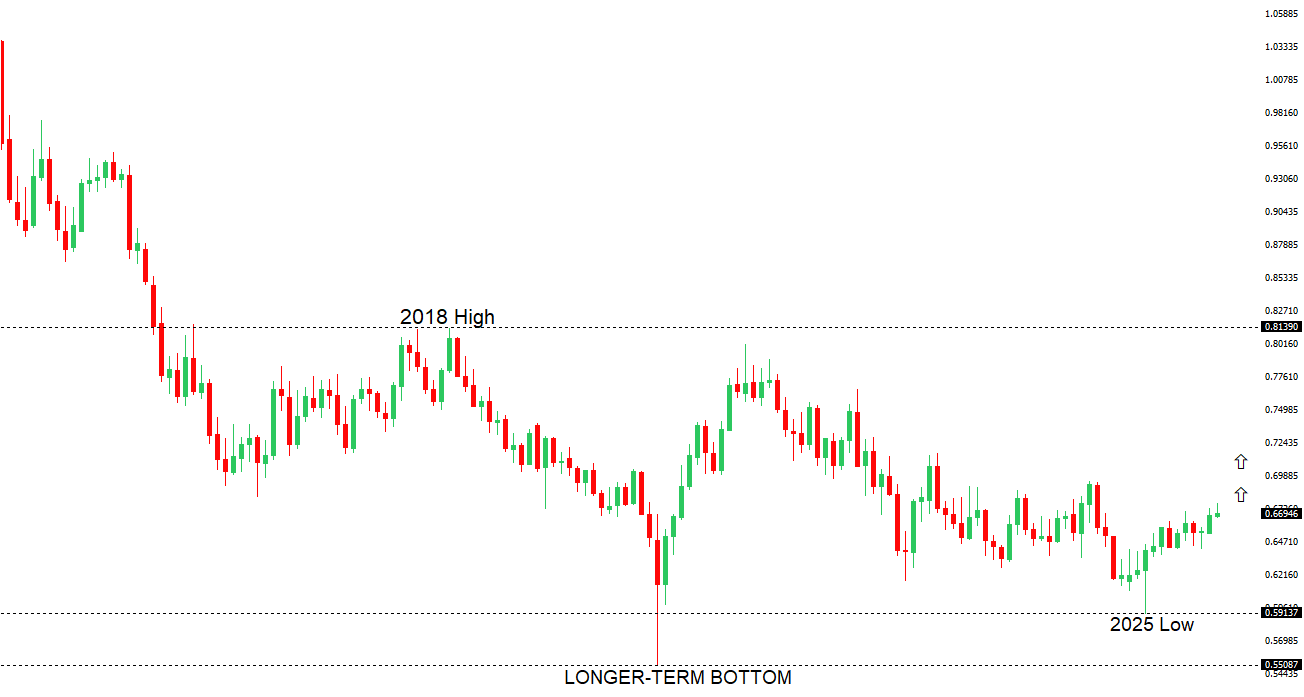 | ||
| R2 0.6800 - Figure - Medium R1 0.6767 - 7 January/2026 high - Medium S1 0.6660 - 31 December low - Medium S2 0.6592 - 18 December low - Strong | ||
| AUDUSD: fundamental overview | ||
| The Australian dollar is the top-performing G10 currency versus the US dollar so far this year, supported by strong domestic data, resilient household spending, and a hawkish RBA that is seen more likely to hike than cut rates. While weaker Chinese demand is a near-term headwind, expected stimulus, a firmer yuan, and strong Chinese trade flows could offset the drag. Markets still price around 40bps of RBA hikes this year, and with US dollar weakness expected over 2026, AUD upside remains intact — though near-term moves will stay highly data-dependent. | ||
| Suggested reading | ||
| The Industrial Renaissance Is Here, T. Slok, Apollo Academy (January 15, 2026) Why Are Credit Card Rates So High?, B. Carlson, AWOCS (January 15, 2026) | ||