


 | ||
| 13th January 2026 | view in browser | ||
| Markets hold firm amid Fed noise and slowing China | ||
| Global markets open mixed but steady, with a softer dollar supporting major currencies, Fed politics making noise without derailing sentiment, and Asia sending mixed signals as growth momentum softens in China and Japan’s weak yen keeps policy in focus. | ||
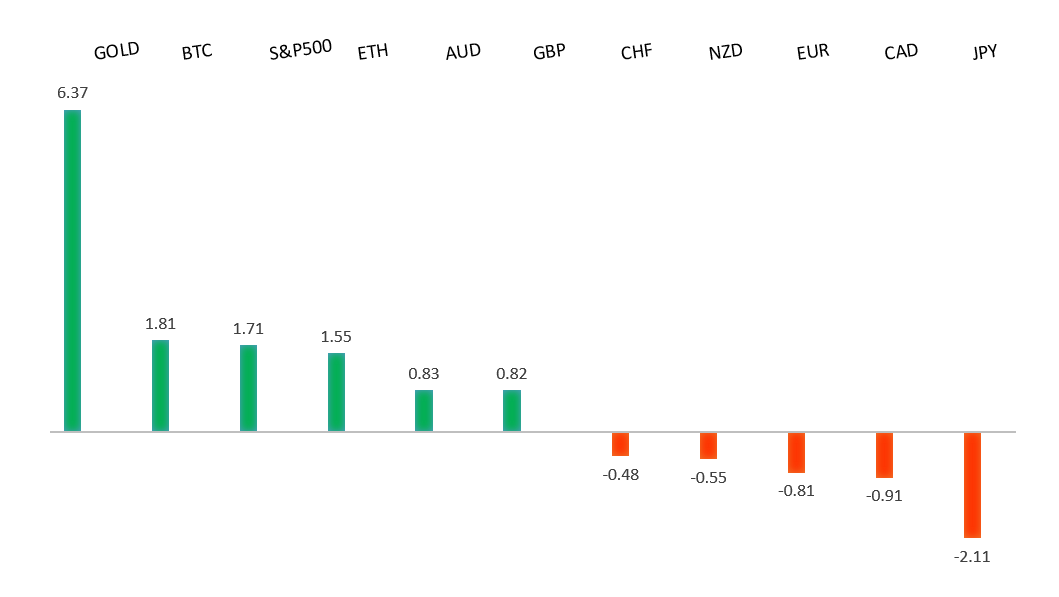
| Performance chart 30day v. USD (%) | ||
 | ||
| Technical & fundamental highlights | ||
| EURUSD: technical overview | ||
| The Euro outlook remains constructive with higher lows sought out on dips in favor of the next major upside extension targeting the 2021 high at 1.2350. Setbacks should be exceptionally well supported ahead of 1.1400. | ||
 | ||
| R2 1.1919 - 17 September/2025 high -Strong R1 1.1765 - 2 Janaury/2026 high - Medium S1 1.1618 - 9 January /2026 low - Medium S2 1.1615 - 9 December low - Strong | ||
| EURUSD: fundamental overview | ||
| The euro edged slightly lower as a mildly stronger dollar ahead of US inflation data kept the pair range-bound, with near-term moves still driven by key US events. However, the recent drop in the dollar is reviving memories of the 2025 “Liberation Day” tariff shock, when the euro and gold benefited as liquid alternatives to the greenback. Investor sentiment in the eurozone has improved sharply, pointing to stabilization rather than further deterioration, and one notable research house expects a small pickup in German growth later this year, supported by stronger investment and industrial output. | ||
| USDJPY: technical overview | ||
| There are signs of a meaningful top in place after the market put in a multi-year high in 2024. At this point, rallies should be well capped ahead of 160.00 ahead of a fresh down-leg back towards the 2024 low at 139.58. A break below 154.39 will strengthen the outlook. | ||
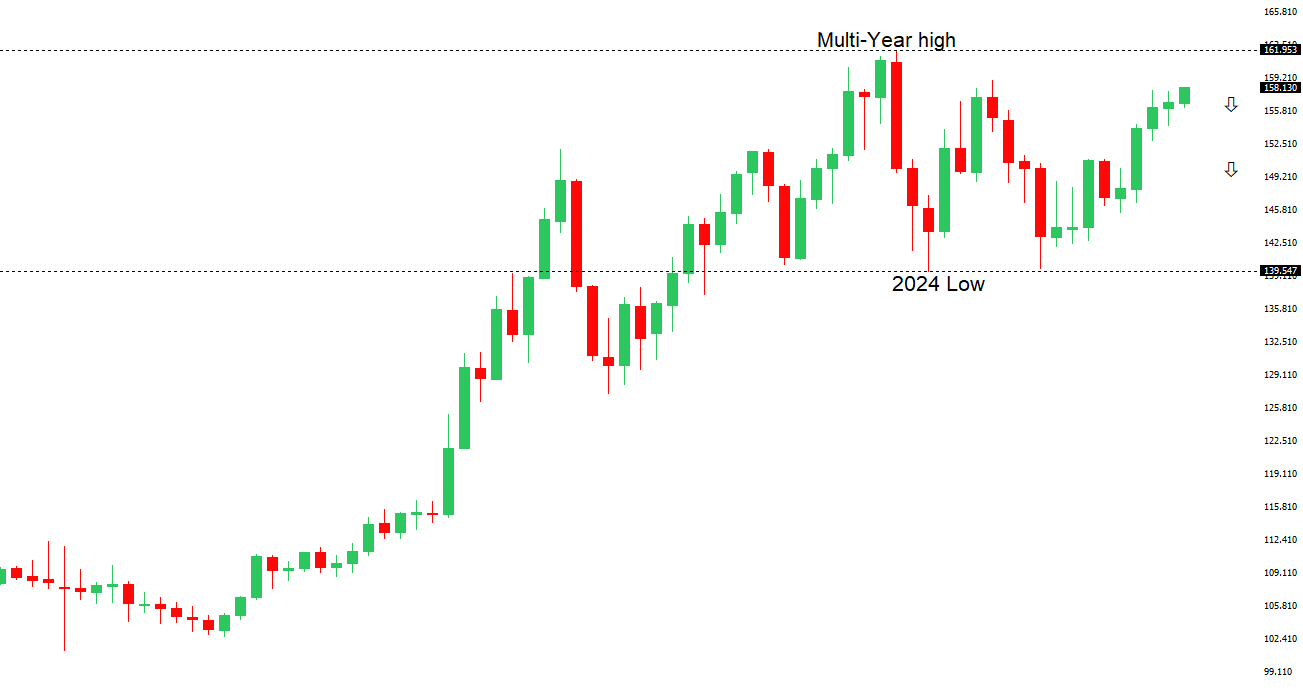 | ||
| R2 160.00 - Psychological - Strong R1 158.92 - 13 January /2026 high - Medium S1 157.52 - 12 January low - Medium S2 156.11 - 5 January/2026 low - Strong | ||
| USDJPY: fundamental overview | ||
| USDJPY jumped to a fresh one-year high, even as Japanese 10-year yields hit their highest level since 1999, because investors remain focused on political uncertainty and expectations that PM Takaichi may pursue stimulus-heavy fiscal policy after a possible February snap election. Markets see this as delaying Japan’s policy normalization and keeping the yen weak, with some banks forecasting further depreciation. Tensions with China, including new curbs on rare-earth exports to Japan, also weigh on growth prospects and the yen, despite Japan posting a solid current-account surplus in November. | ||
| AUDUSD: technical overview | ||
| There are signs of the potential formation of a longer-term base with the market trading down into a meaningful longer-term support zone. Only a monthly close below 0.5500 would give reason for rethink. A monthly close back above 0.7000 will take the big picture pressure off the downside and strengthen case for a bottom. | ||
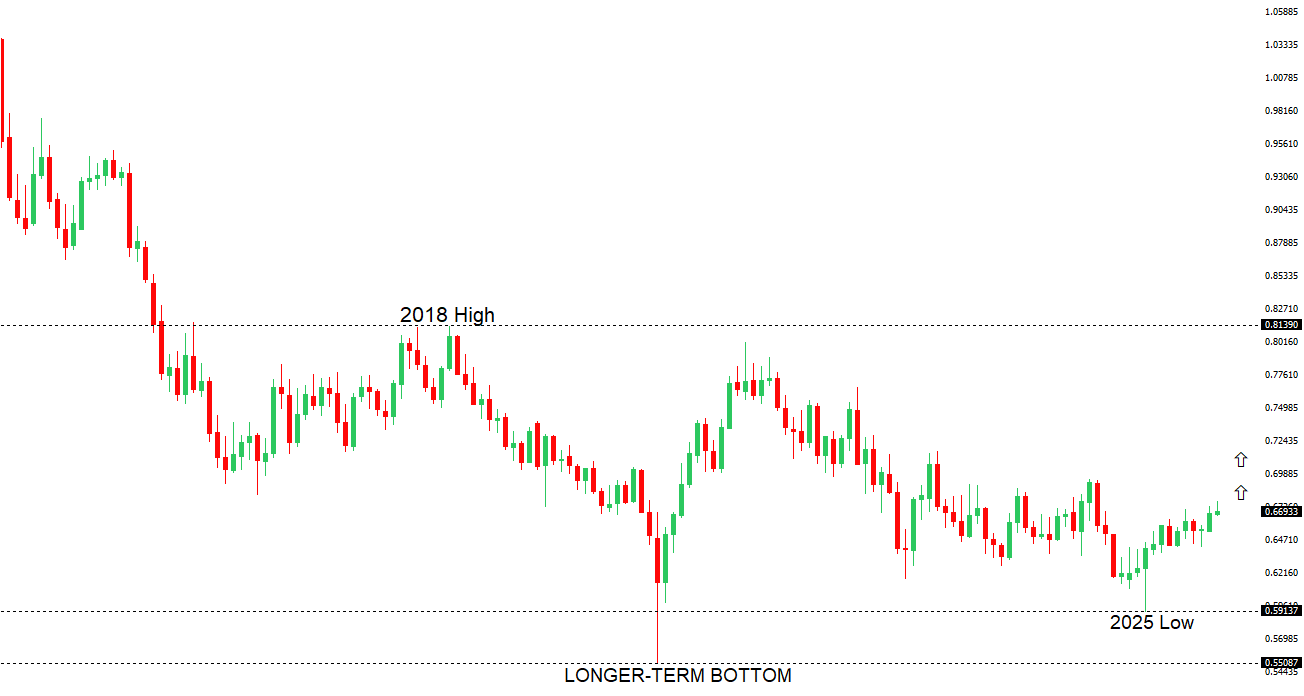 | ||
| R2 0.6800 - Figure - Medium R1 0.6767 - 7 January/2026 high - Medium S1 0.6660 - 31 December low - Medium S2 0.6592 - 18 December low - Strong | ||
| AUDUSD: fundamental overview | ||
| The Australian dollar is little changed after Monday’s gains, as markets continue to price in a possible RBA rate hike later this year. Strong November household spending and ongoing warnings from RBA officials that inflation remains “too high” are keeping pressure on policymakers, even as job ads point to a cooling labor market and consumer sentiment stays weak. Markets are watching December jobs and Q4 inflation data closely ahead of the February RBA meeting to assess whether a rate rise is becoming more likely. | ||
| Suggested reading | ||
| Friendly Reminder That Sentiment Affects Bond Markets Too, Fisher Investments (January 9, 2026) A Casino In Every Pocket, S. Hariharan, Dopamine Markets (January 8, 2026) | ||