


 | ||
| 10th September 2026 | view in browser | ||
| Oil, yields and the return of inflation anxiety | ||
| Global markets head into Thursday on a cautious footing as escalating Middle East tensions and rising oil prices fuel inflation concerns, lift bond yields, pressure equities and leave major currencies subdued ahead of the ECB decision and US inflation data. | ||
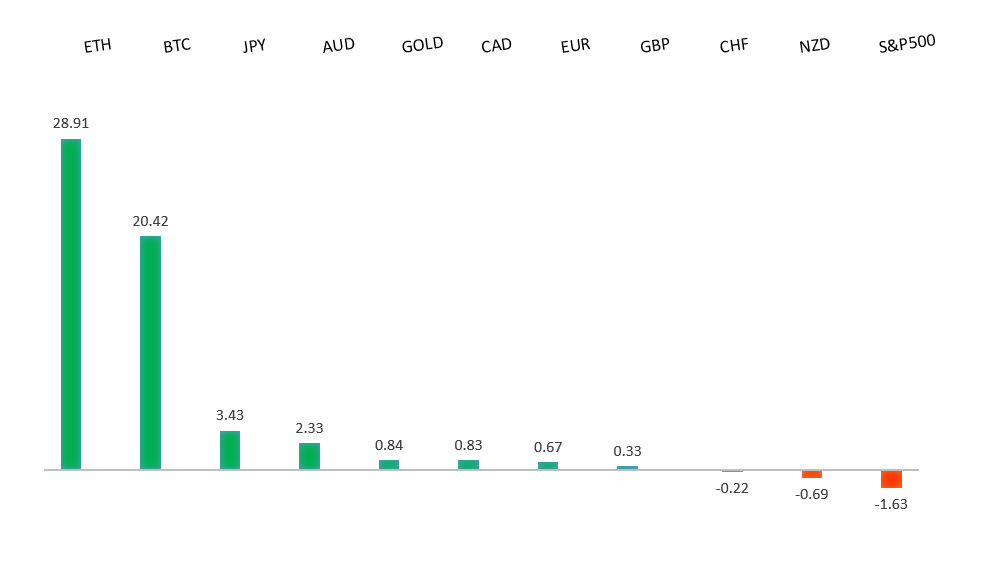
| Performance chart 30day v. USD (%) | ||
 | ||
| Technical & fundamental highlights | ||
| EURUSD: technical overview | ||
| The Euro outlook remains constructive with higher lows sought out on dips in favor of the next major upside extension targeting the 2021 high at 1.2350. Setbacks should be exceptionally well supported ahead of 1.1400. | ||
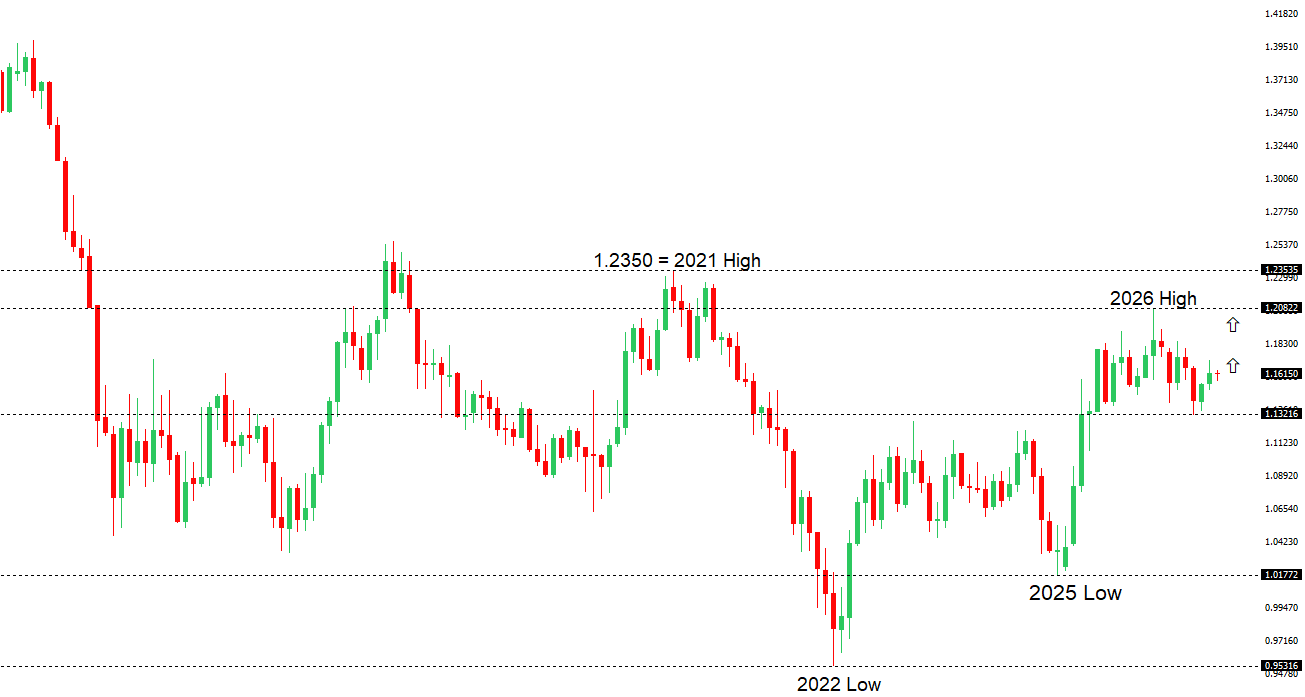 | ||
| R2 1.1712 - 21 August high - Strong R1 1.1660 - 27 August high - Medium S1 1.1566 - 2 September low - Medium S2 1.1512 - 313 August low - Strong | ||
| EURUSD: fundamental overview | ||
| The euro is holding firm above 1.1600 as markets await today’s ECB decision, with a quarter-point rate hike widely expected after surging energy prices pushed Eurozone inflation further above target. The immediate focus will be on the ECB’s updated forecasts and whether President Lagarde signals that persistent inflation risks could justify additional tightening, although concerns about weak regional growth may limit how firmly she commits to further moves. Meanwhile, EURUSD remains sensitive to the US side of the equation, with today’s producer inflation report and Friday’s CPI release set to shape expectations for the Federal Reserve and the broader direction of the dollar. | ||
| GBPUSD: technical overview | ||
| The Pound remains exceptionally well supported on dips into the 1.3000 area, with the price largely consolidating above the psychological barrier and previous resistance turned support in the form of the 2023 high. Look for the market to continue be well supported on dips ahead of the next major upside extension through the yearly high at 1.3870 and towards a retest of the 2018 high at 1.4377 further up. Only a monthly close below 1.3000 negates. | ||
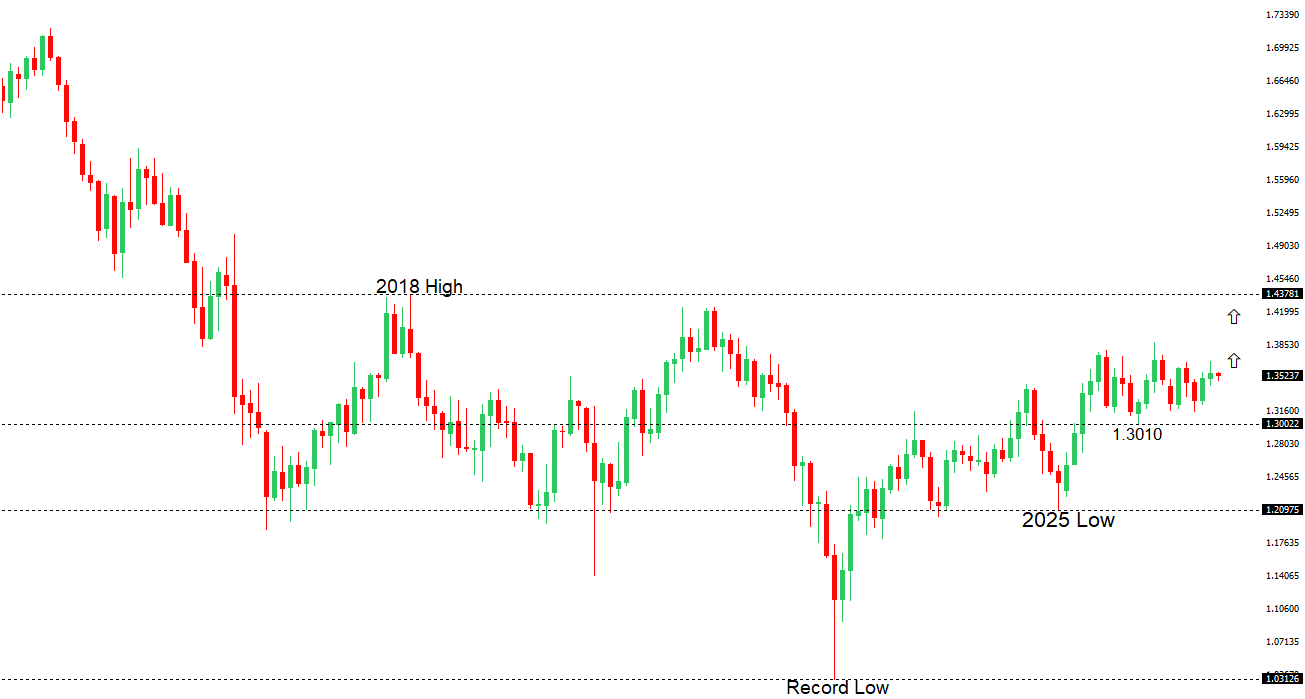 | ||
| R2 1.3676 - 21 August high - Strong R1 1.3568 - 9 September high - Medium S1 1.3474 - 13 August low - Medium S2 1.3400 - 31 July low - Medium | ||
| GBPUSD: fundamental overview | ||
| The pound has extended its advance against the US dollar, supported primarily by broad dollar weakness and gradually firming expectations for additional Bank of England tightening later this year. UK housing data offered some encouragement, with the RICS survey reaching a five-month high and pointing to early signs of stabilization, although the recovery remains fragile. Markets expect the BoE to leave rates unchanged at next week’s meeting but are pricing a greater chance of incremental hikes into year-end. Near-term direction remains heavily dependent on upcoming US producer and consumer inflation data, which will shape expectations for the Federal Reserve after strong employment figures boosted the probability of another rate increase. | ||
| USDJPY: technical overview | ||
| The recent breakdown below 155.00 suggests the market could be on the verge of a bigger structural shift, with the possibility for an end to a longer-term uptrend and the start to a period of persistent weakness. Critical support now comes in the form of the 2026 low from January at 151.97, with a drop below to strengthen the bearish outlook and open the door for a major downside extension targeting the 2024 low at 139.58. The market would need to get back above 160.00 to take the immediate pressure off the downside. | ||
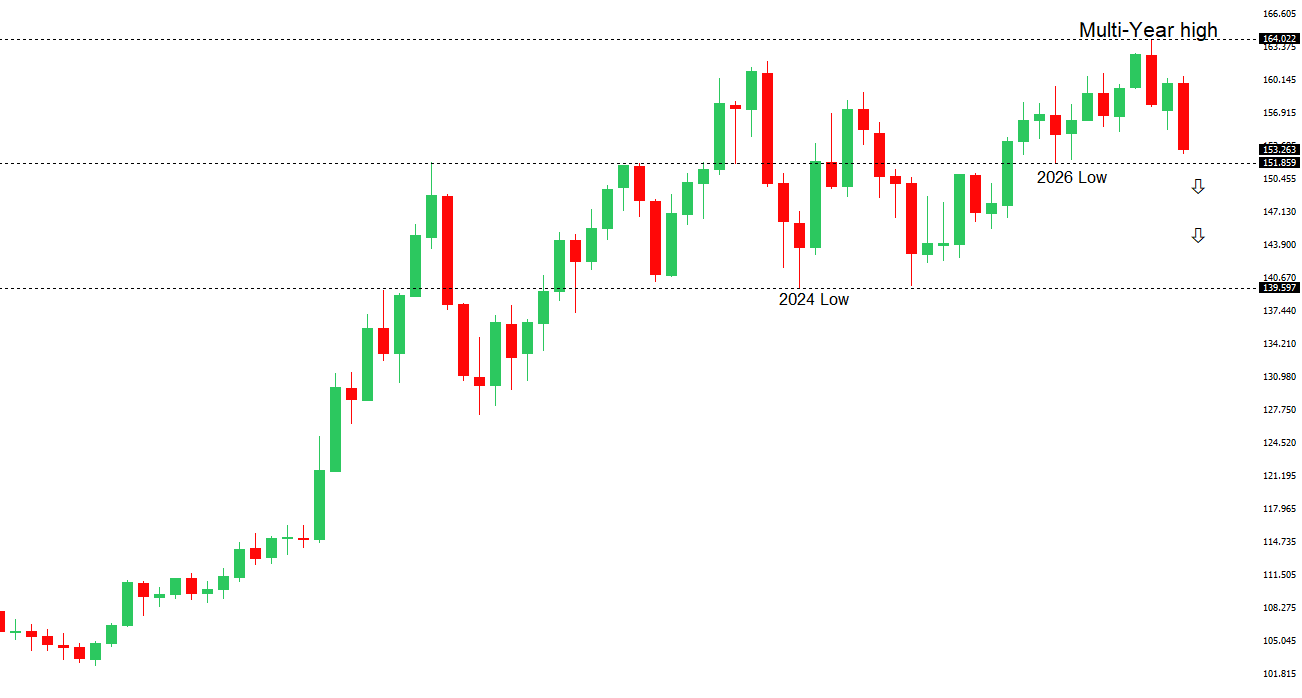 | ||
| R2 156.75 - 4 September high - Strong R1 154.43 - 8 September high - Medium S1 152.88 - 8 September low - Medium S2 151.97 - 28 January/2026 low - Strong | ||
| USDJPY: fundamental overview | ||
| The yen has eased from a seven-month high against the dollar as traders lock in profits and turn cautious ahead of key US inflation data. The broader fundamental backdrop remains supportive, however, with markets fully pricing a Bank of Japan rate hike in September and assigning a strong probability to another move in December following hawkish signals from policymakers, solid wage growth and an upward revision to Japanese economic growth. Meanwhile, expectations for another Federal Reserve rate hike, elevated energy-driven inflation risks and escalating US-Iran tensions have helped the dollar recover modestly. Even so, the increasingly hawkish BoJ outlook should continue to underpin the yen and limit the scope for a sustained USDJPY rebound. | ||
| AUDUSD: technical overview | ||
| There are signs of the formation of a longer-term base with the market recovering out from a meaningful longer-term support zone. The latest monthly close back above 0.7000 takes the big picture pressure off the downside and strengthens the case for a bottom, with the focus now on a push towards 0.8000. Setbacks should now be well supported ahead of 0.6700. | ||
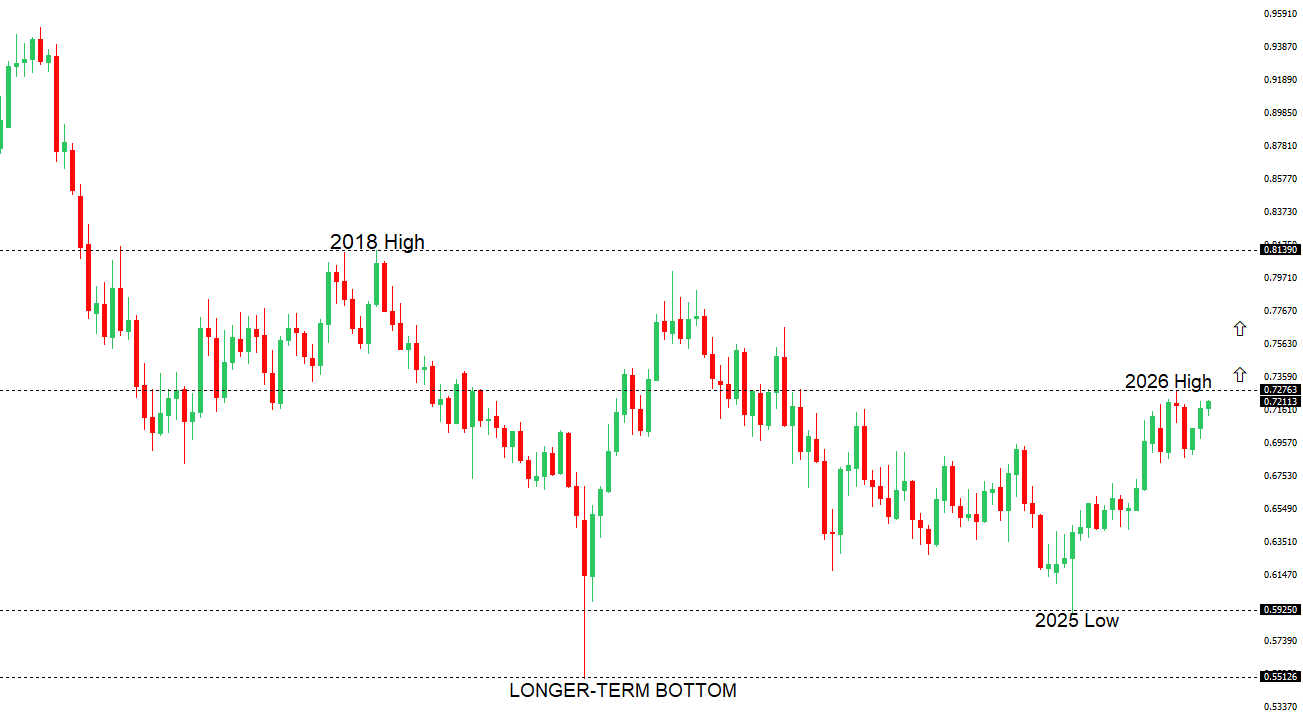 | ||
| R2 0.7278 - 6 May/2026 high - Strong R1 0.7238 - 9 September high - Medium S1 0.7121 - 2 September low - Medium S2 0.7067 - 19 August low - Medium | ||
| AUDUSD: fundamental overview | ||
| The Australian dollar has eased up a bit from recent highs as markets turn cautious ahead of key US inflation data, with the upcoming PPI and CPI reports set to shape expectations for next week’s Federal Reserve decision. Strong US employment data has revived the prospect of another Fed rate hike, supporting the US dollar, while escalating Middle East tensions have weighed on risk-sensitive currencies such as the Aussie. Nevertheless, downside pressure remains limited by an increasingly hawkish Reserve Bank of Australia outlook, after officials Sarah Hunter and Andrew Hauser signaled further tightening may be required if inflation remains persistent. This has encouraged expectations for additional RBA rate hikes and continues to provide underlying support for the Australian dollar. | ||
| Suggested reading | ||
| Was Jesus anti-capitalist? | The Story of Money, J. Tett, Financial Times (September 9, 2026) Down Slightly On a Safe Asset Can Be Jarring, J. Calhoun, Alhambra (September 7, 2026) | ||