Day Image
9th September 2025 | view in browser
Labor woes lock in Fed cuts

Last week’s disappointing nonfarm payrolls report has solidified expectations for a Federal Reserve rate cut in September, with markets even considering a larger 50-basis-point reduction. Investors are closely watching upcoming August PPI and CPI data for signs of controlled inflation, though CPI is expected to rise to 2.9% from 2.7%, indicating persistent price pressures.


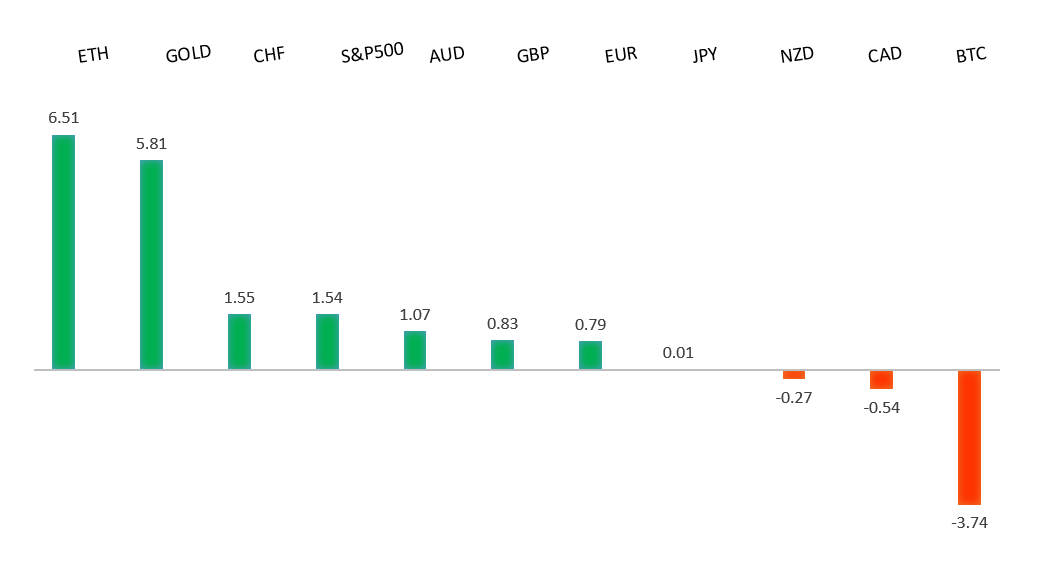
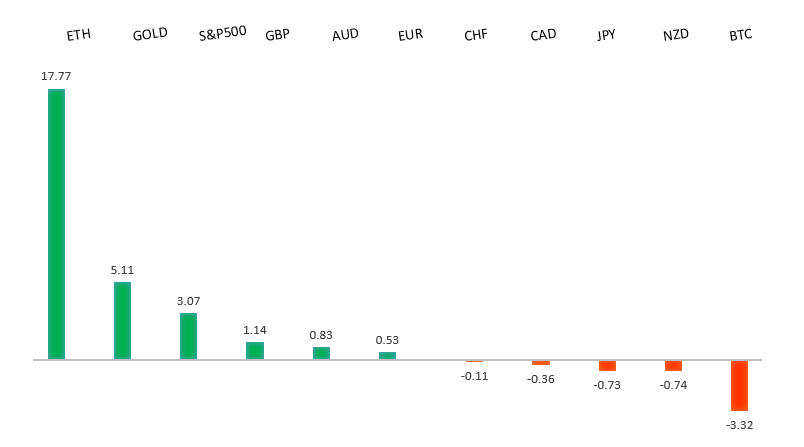
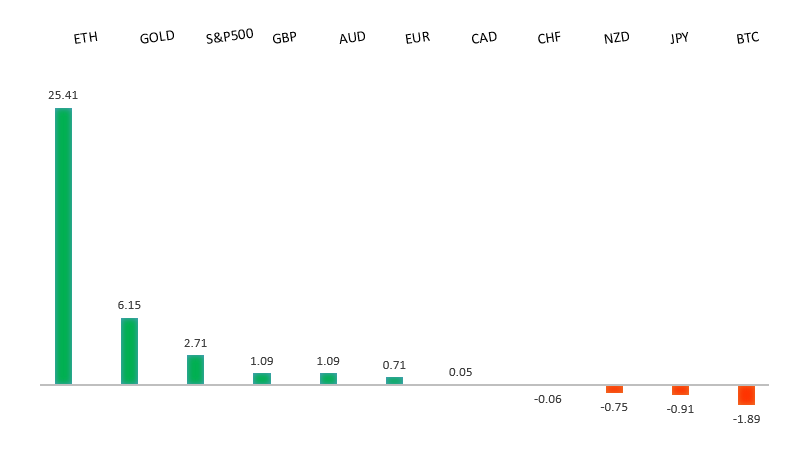
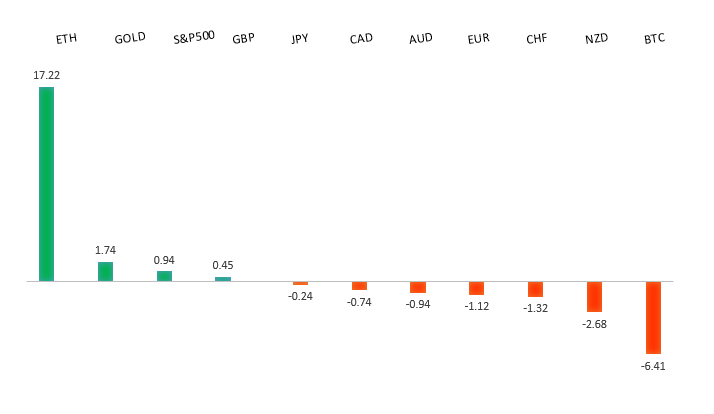
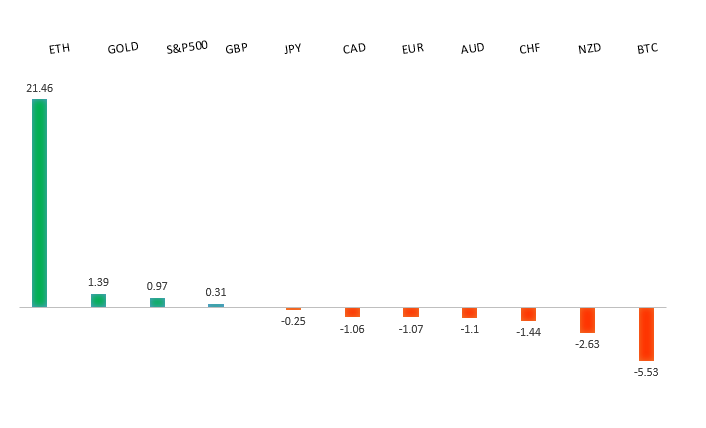
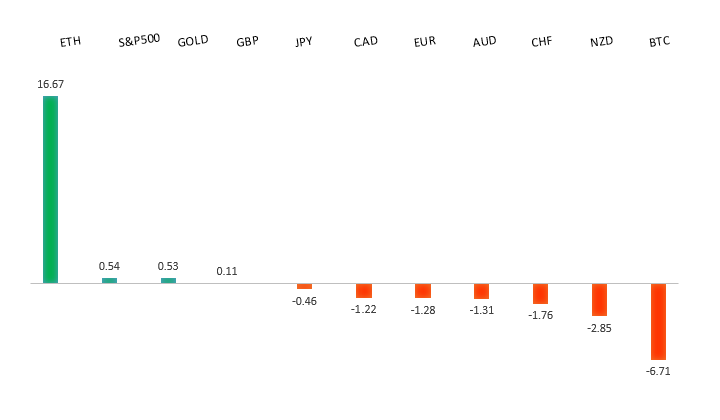
Performance chart 30day v. USD (%)
Performance Chart
 
 
Technical & fundamental highlights
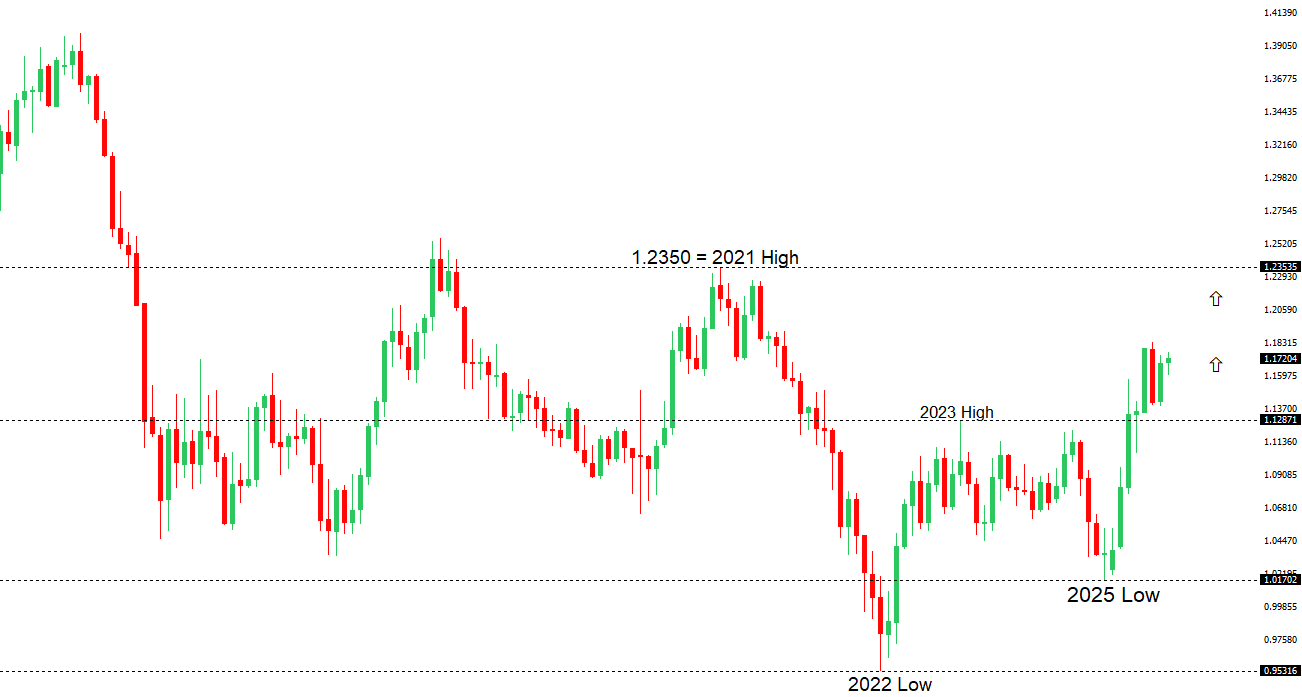
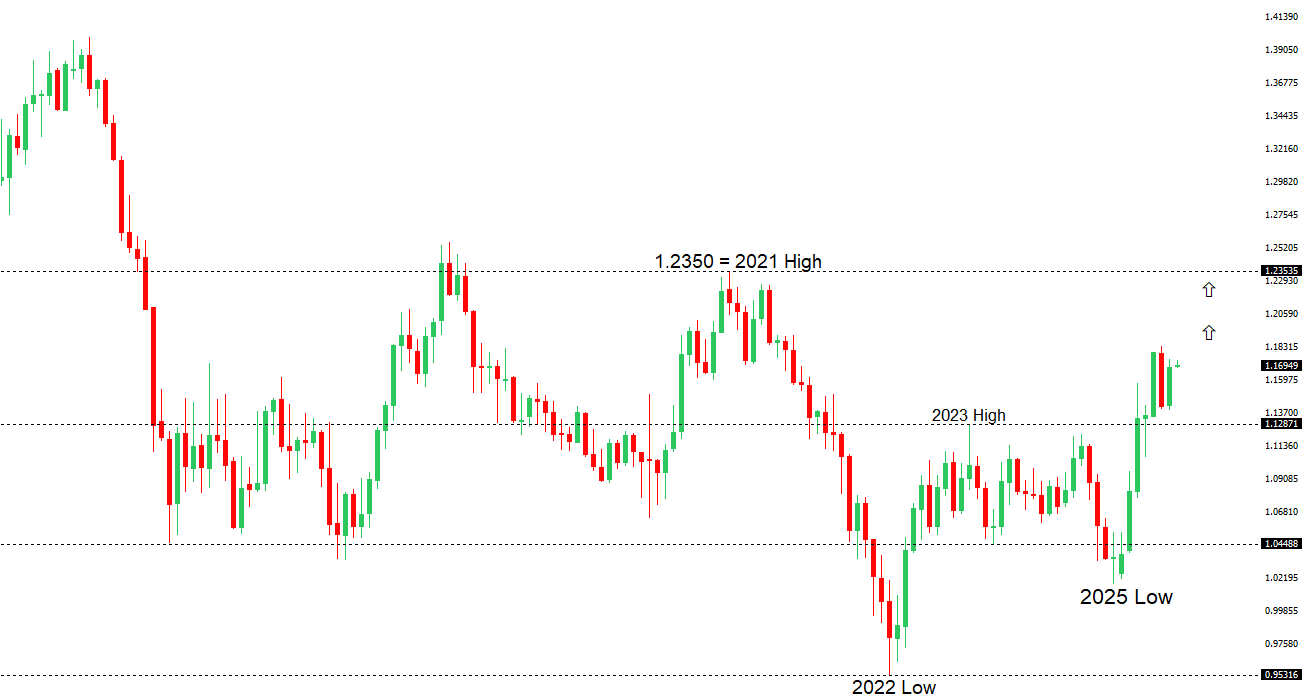
EURUSD: technical overview

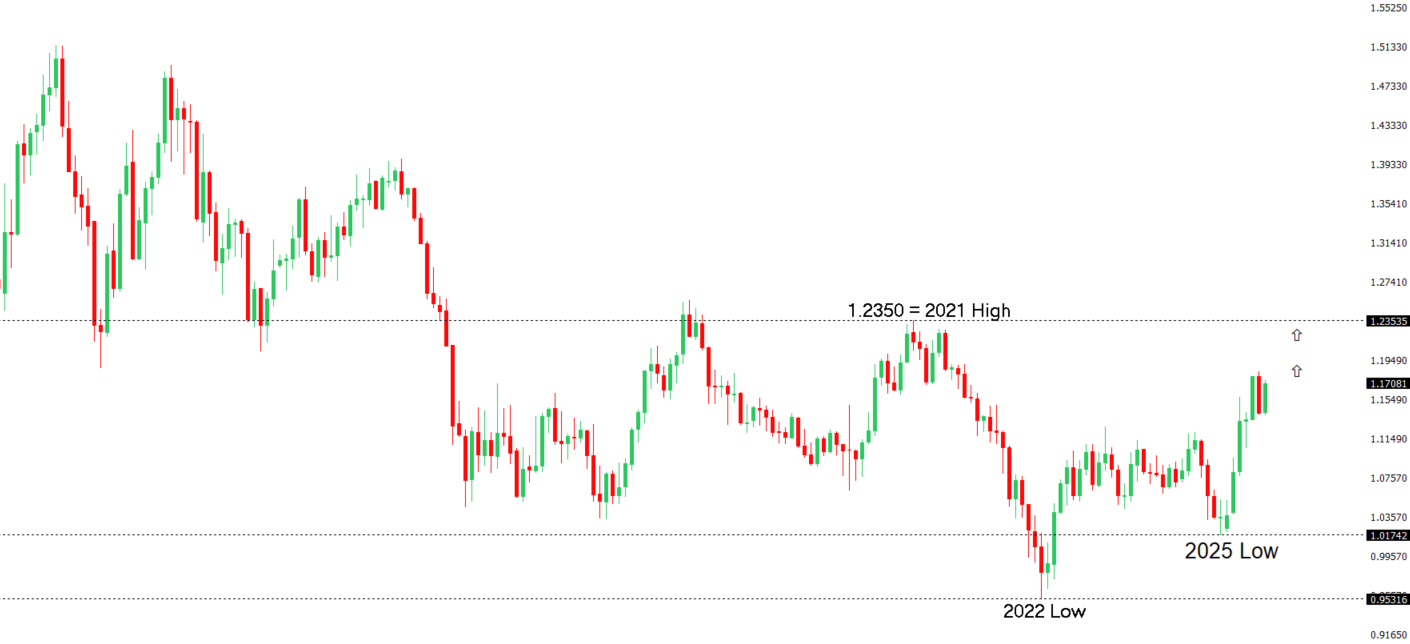
The Euro has broken out from a multi-month consolidation off a critical longer-term low. This latest push through the 2023 high (1.1276) lends further support to the case for a meaningful bottom, setting the stage for a bullish structural shift and the next major upside extension targeting the 2021 high at 1.2350. Setbacks should be exceptionally well supported ahead of 1.1000.

EURUSD Chart
R2 1.1830 - 1 July/2025 high - Strong
R1 1.1789 - 24 July high - Medium
S1 1.1608 - 3 September low - Medium
S2 1.1574 - 27 August low - Strong
EURUSD: fundamental overview

Central bank policy divergence, with the Federal Reserve likely cutting rates while the ECB holds steady, supports a stronger euro, with one bank forecasting a rise above $1.20 by year-end. German industrial production in July exceeded expectations, hinting at stabilization, but a narrowing trade surplus and weaker exports highlight ongoing challenges for Germany’s export-driven economy, with recovery prospects uncertain amid potential U.S. tariff risks in 2025.

 
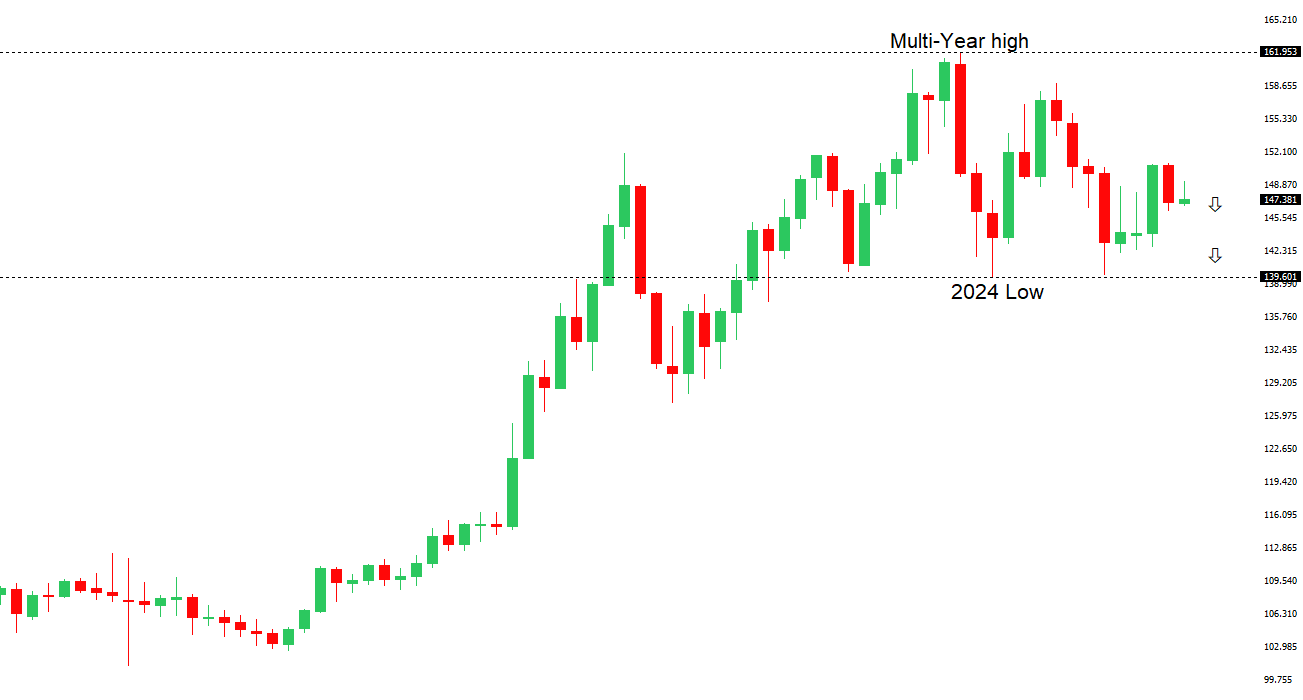
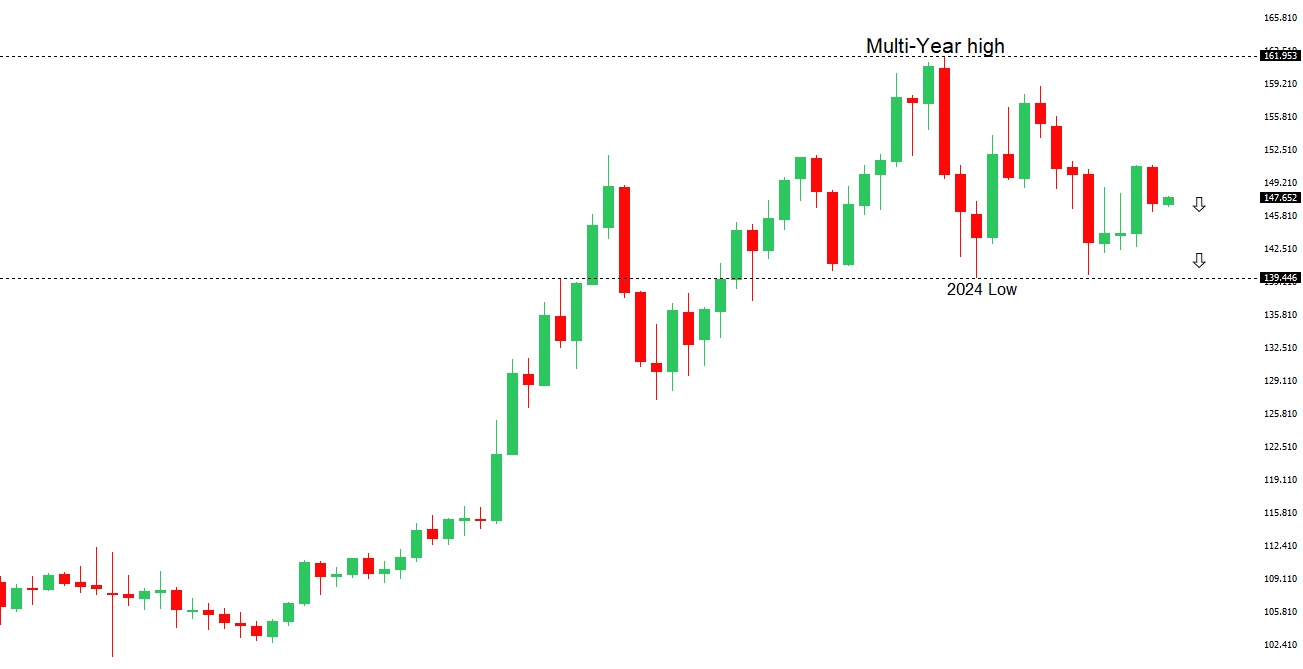
USDJPY: technical overview

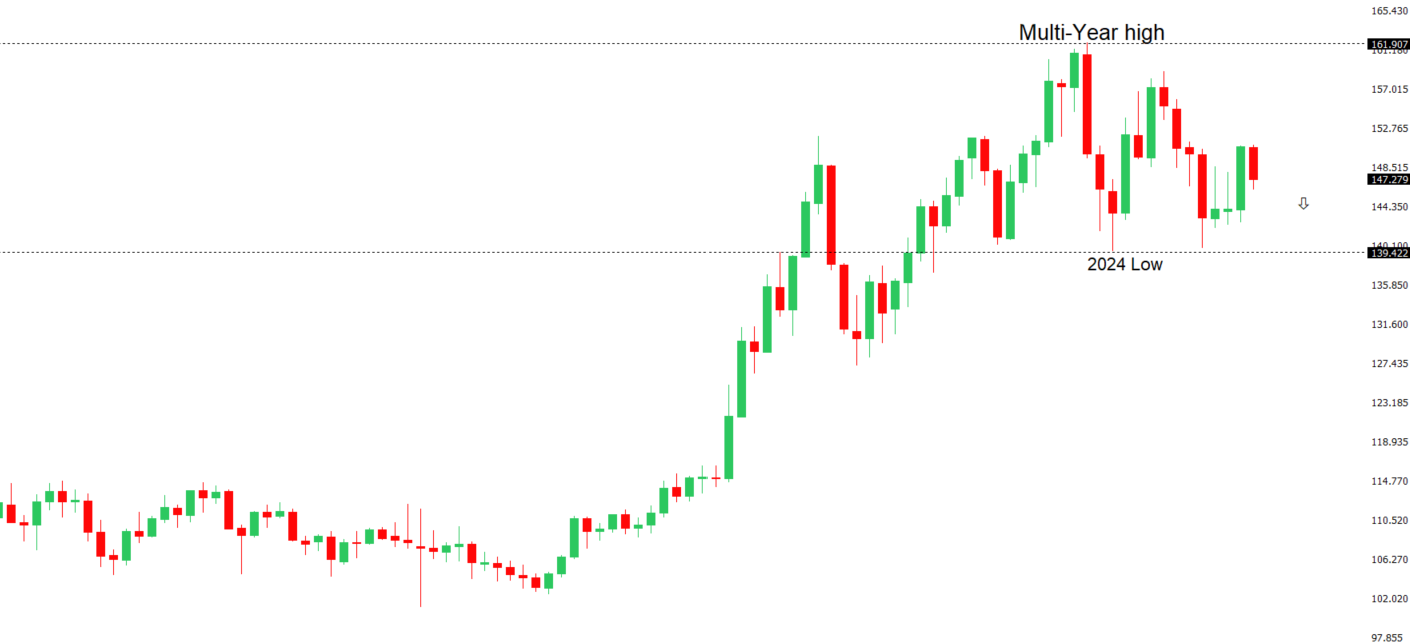
There are signs of a meaningful top in place after the market put in a multi-year high in 2024. At this point, the door is now open for a deeper setback below the 2024 low at 139.58, exposing a retest of the 2023 low. Rallies should be well capped below 152.00.

USDJPY Chart
R2 150.92 - 1 August high - Strong
R1 149.14 - 3 September high - Medium
S1 146.21 - 14 August low - Medium
S2 145.85 - 24 July low - Strong
USDJPY: fundamental overview

The Yen has held up relatively well, despite Japan’s political uncertainty following Ishiba’s resignation, with narrowing U.S.-Japan rate differentials factoring into the price action. Japan’s Q2 GDP growth was revised upward to 2.2%, driven by strong consumption, capital spending, and exports, though new U.S. tariffs may dampen future growth, keeping the Bank of Japan cautious on rate hikes. Political uncertainty, particularly around the Liberal Democratic Party leadership race, risks further yen weakness and higher Japanese government bond yields, with outcomes hinging on whether fiscal expansionist Sanae Takaichi or reform-focused Shinjiro Koizumi wins. Despite some optimism from reduced U.S. tariffs on Japanese autos, the BoJ is unlikely to shift policy soon, though LDP lawmaker Kono Taro supports rate hikes to bolster the yen and curb inflation.

 
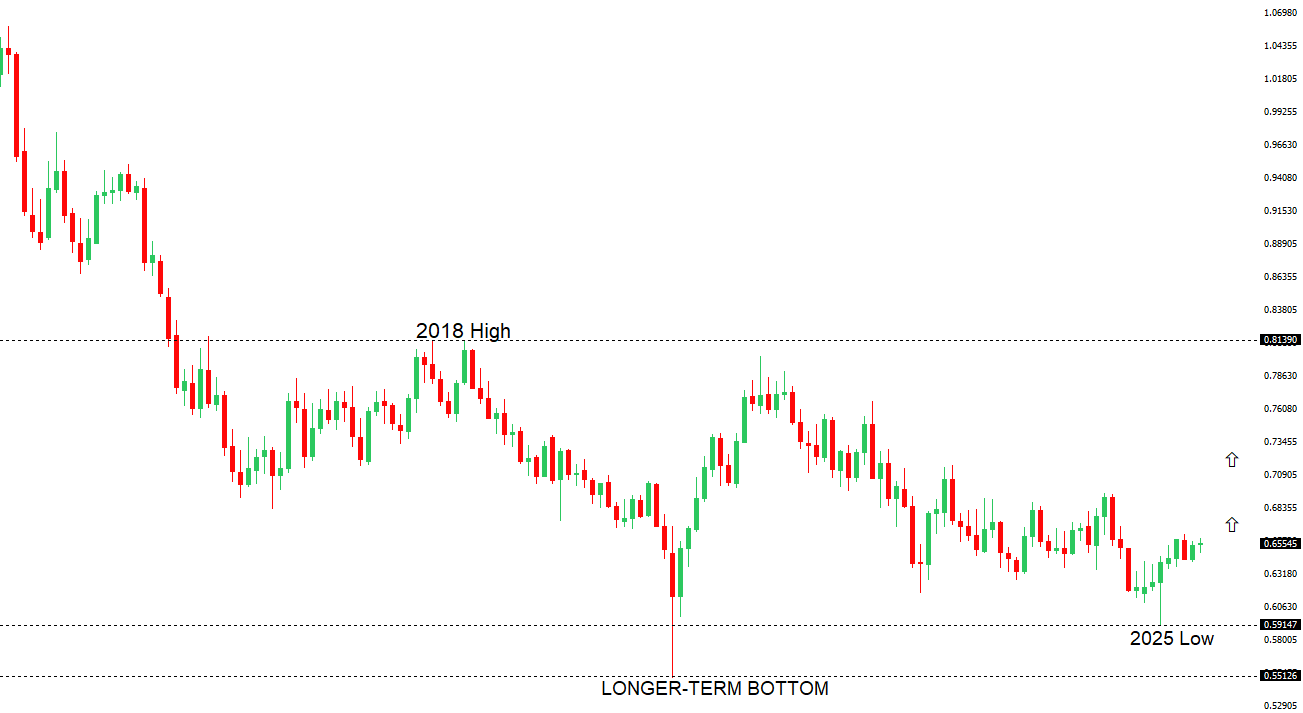
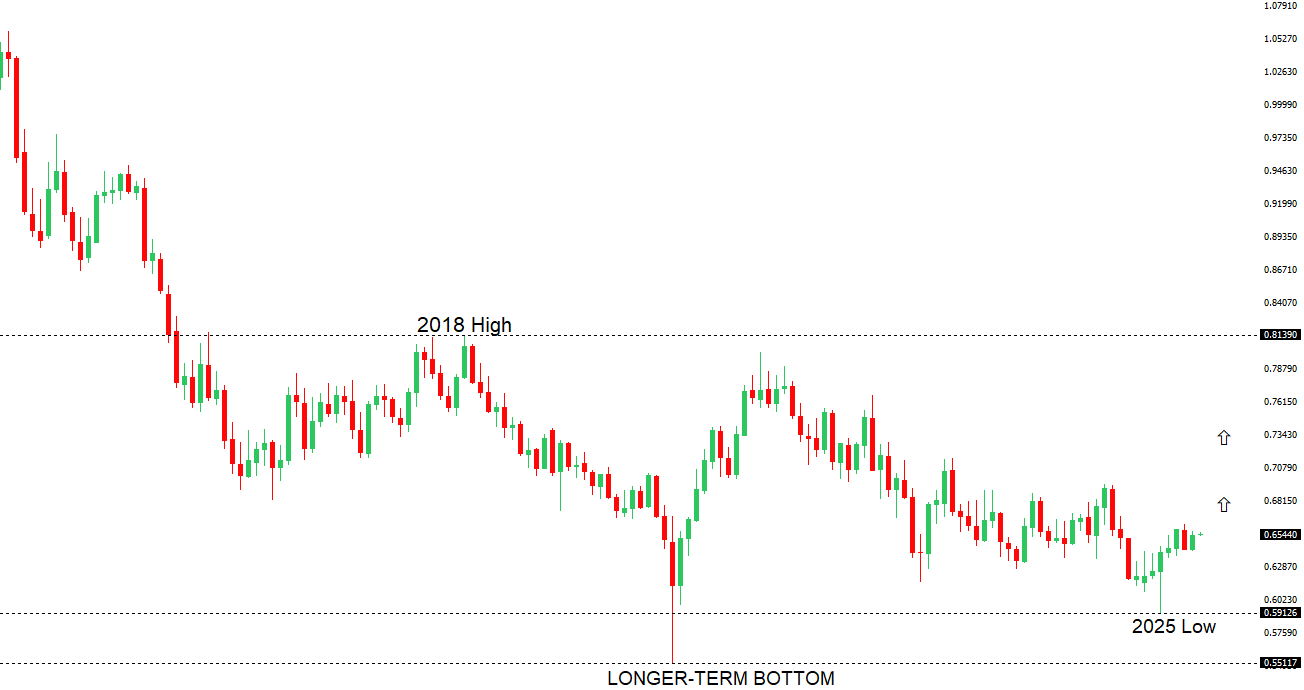
AUDUSD: technical overview

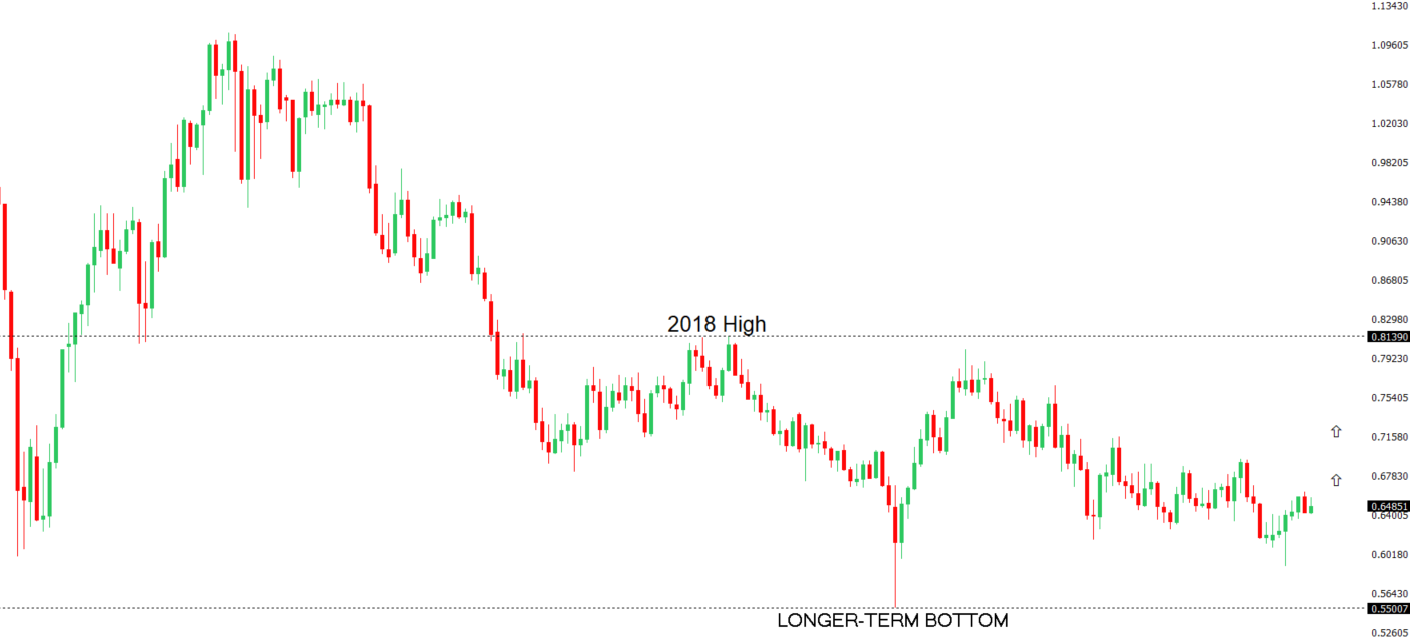
There are signs of the potential formation of a longer-term base with the market trading down into a meaningful longer-term support zone. Only a monthly close below 0.5500 would give reason for rethink. A monthly close back above 0.7000 will take the big picture pressure off the downside and strengthen case for a bottom.

AUDUSD Chart
R2 0.6700 - Figure - Medium
R1 0.6625 - 24 July/2025 high - Strong
S1 0.6483 - 2 September low - Medium
S1 0.6414 - 22 August low - Strong
AUDUSD: fundamental overview

The Australian dollar remains bullish following weak U.S. jobs data, which has increased expectations for a significant Federal Reserve rate cut in September. Upcoming U.S. inflation data (PPI and CPI) and Australian economic indicators, including consumer and business confidence, will influence the AUD’s near-term trajectory. Strong Australian GDP growth, driven by robust household consumption and exports, has reduced the likelihood of a November RBA rate cut to 80%, with the RBA likely to maintain steady rates unless consumer sentiment weakens further. Despite a recent drop in consumer confidence, improved business conditions and positive Chinese economic data support the AUD’s resilience.

 
Suggested reading

A Monetary Schism? The Avignon Federal Reserve, R. Wigglesworth, FT Alphaville (September 3, 2025)

The Myths Of Chinese Exceptionalism, S. Sumner, The Pursuit of Happiness (September 3, 2025)


Any opinions, news, research, analyses, prices or other information ("information") contained on this Blog, constitutes marketing communication and it has not been prepared in accordance with legal requirements designed to promote the independence of investment research. Further, the information contained within this Blog does not contain (and should not be construed as containing) investment advice or an investment recommendation, or an offer of, or solicitation for, a transaction in any financial instrument. LMAX Group has not verified the accuracy or basis-in-fact of any claim or statement made by any third parties as comments for every Blog entry.

LMAX Group will not accept liability for any loss or damage, including without limitation to, any loss of profit, which may arise directly or indirectly from use of or reliance on such information. No representation or warranty is given as to the accuracy or completeness of the above information. While the produced information was obtained from sources deemed to be reliable, LMAX Group does not provide any guarantees about the reliability of such sources. Consequently any person acting on it does so entirely at his or her own risk. It is not a place to slander, use unacceptable language or to promote LMAX Group or any other FX and CFD provider and any such postings, excessive or unjust comments and attacks will not be allowed and will be removed from the site immediately.

Day Image
7th September 2025 | view in browser
Fed rate cuts expected after weak jobs report

The US dollar index dropped as Treasury yields fell after a disappointing August jobs report showed only 22,000 nonfarm payrolls added, far below the expected 75,000, with the unemployment rate rising to 4.3%, the highest since October 2021.


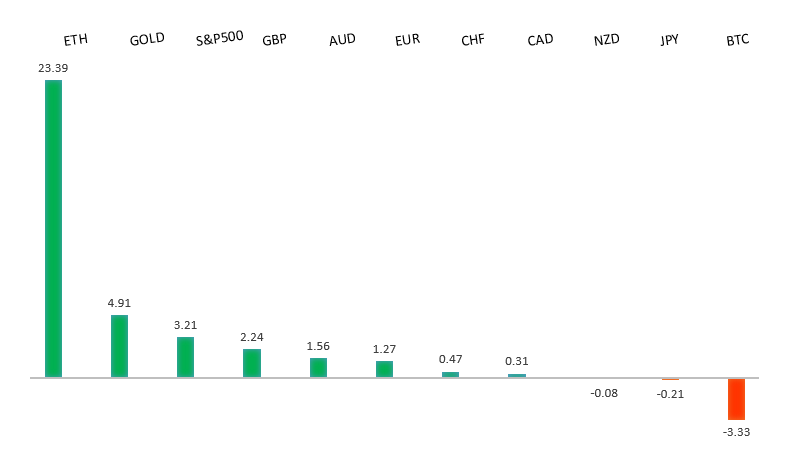
Performance chart 30day v. USD (%)
Performance Chart
 
 
Technical & fundamental highlights
EURUSD: technical overview

The Euro has broken out from a multi-month consolidation off a critical longer-term low. This latest push through the 2023 high (1.1276) lends further support to the case for a meaningful bottom, setting the stage for a bullish structural shift and the next major upside extension targeting the 2021 high at 1.2350. Setbacks should be exceptionally well supported ahead of 1.1000.

EURUSD Chart
R2 1.1789 - 24 July high - Medium
R1 1.1760 - 5 September high - Medium
S1 1.1583 - 22 August low - Medium
S2 1.1392 - 1 August low - Strong
EURUSD: fundamental overview
The euro surged to its highest since late July, due to a weakened US dollar following disappointing US jobs data, which has solidified expectations for Federal Reserve rate cuts in 2025. European stock markets, including the STOXX 50 and STOXX 600, declined slightly, reflecting concerns about the US economy and a stronger euro impacting export-driven companies like Siemens and Airbus. The Eurozone economy grew 1.5% annually in Q2 2025, but quarterly growth slowed to 0.1%, with Germany and Italy seeing GDP contractions, while employment continued to rise modestly.
 
USDJPY: technical overview

There are signs of a meaningful top in place after the market put in a multi-year high in 2024. At this point, the door is now open for a deeper setback below the 2024 low at 139.58, exposing a retest of the 2023 low. Rallies should be well capped below 152.00.

USDJPY Chart
R2 150.92 - 1 August high - Strong
R1 149.14 - 3 September high - Medium
S1 146.21 - 14 August low - Medium
S2 145.85 - 24 July low - Strong
USDJPY: fundamental overview
Japanese Prime Minister Shigeru Ishiba resigned on Sunday, citing recent election losses and the completion of US trade negotiations, which reduced tariffs on Japanese cars, causing USDJPY to rise and sparking market uncertainty. Japan’s economy grew robustly at 2.2% annualized in Q2 2025, driven by strong domestic demand, though the current account surplus shrank to JPY 2,684.3 billion in July. Potential successors like Sanae Takaichi and Shinjiro Koizumi could influence fiscal and monetary policies, with markets wary of increased bond yields and a weaker yen, while the Nikkei 225 climbed 1.3% amid positive trade developments.
 
AUDUSD: technical overview

There are signs of the potential formation of a longer-term base with the market trading down into a meaningful longer-term support zone. Only a monthly close below 0.5500 would give reason for rethink. A monthly close back above 0.7000 will take the big picture pressure off the downside and strengthen case for a bottom.

AUDUSD Chart
R2 0.6600 - Figure - Medium
R1 0.6589 - 5 September high - Medium
S1 0.6414 - 22 August low - Medium
S1 0.6373 - 23 June low - Strong
AUDUSD: fundamental overview
The Australian dollar hit a six-week high after a weak US jobs report increased expectations for Federal Reserve rate cuts in September, with markets pricing in a 25-basis-point cut and a possible 50-basis-point reduction. The S&P/ASX 200 gained 0.5%, driven by strong performances in banking and gold stocks, though it recorded a 1.1% weekly loss due to mixed economic signals. Despite robust Australian economic growth and a wider trade surplus, the 10-year bond yield dipped to 4.30%, and the Reserve Bank of Australia may hold off on rate cuts if consumer spending remains strong.
 
Suggested reading

Why Does the Crazy Market Keep Ignoring Bogle’s ‘Iron Rule’?, T. Kim, Barron’s (September 3, 2025)

Despite Solid Economic Data, Skepticism Remains, Fisher Investments (September 3, 2025)


Any opinions, news, research, analyses, prices or other information ("information") contained on this Blog, constitutes marketing communication and it has not been prepared in accordance with legal requirements designed to promote the independence of investment research. Further, the information contained within this Blog does not contain (and should not be construed as containing) investment advice or an investment recommendation, or an offer of, or solicitation for, a transaction in any financial instrument. LMAX Group has not verified the accuracy or basis-in-fact of any claim or statement made by any third parties as comments for every Blog entry.

LMAX Group will not accept liability for any loss or damage, including without limitation to, any loss of profit, which may arise directly or indirectly from use of or reliance on such information. No representation or warranty is given as to the accuracy or completeness of the above information. While the produced information was obtained from sources deemed to be reliable, LMAX Group does not provide any guarantees about the reliability of such sources. Consequently any person acting on it does so entirely at his or her own risk. It is not a place to slander, use unacceptable language or to promote LMAX Group or any other FX and CFD provider and any such postings, excessive or unjust comments and attacks will not be allowed and will be removed from the site immediately.

Day Image
5th September 2025 | view in browser
US jobs report and Fed implications

Friday’s US jobs report is expected to significantly influence markets, with forecasts suggesting modest job growth. Of course, all eyes will be on investor sentiment in the aftermath and how this impact Fed pricing.


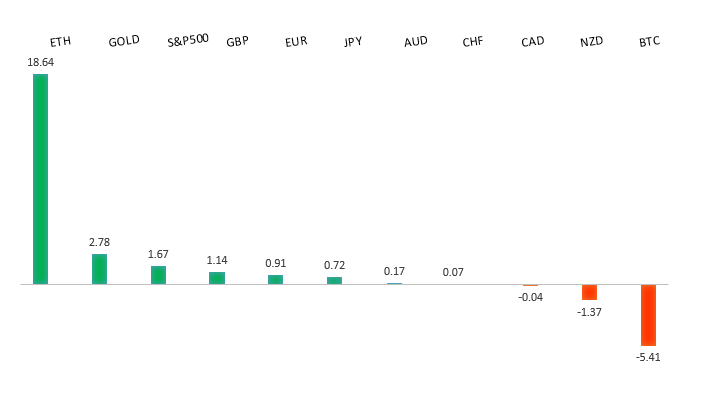
Performance chart 30day v. USD (%)
Performance Chart
 
 
Technical & fundamental highlights
EURUSD: technical overview

The Euro has broken out from a multi-month consolidation off a critical longer-term low. This latest push through the 2023 high (1.1276) lends further support to the case for a meaningful bottom, setting the stage for a bullish structural shift and the next major upside extension targeting the 2021 high at 1.2350. Setbacks should be exceptionally well supported ahead of 1.1000.

EURUSD Chart
R2 1.1789 - 24 July high - Medium
R1 1.1743 - 22 August high - Medium
S1 1.1583 - 22 August low - Medium
S2 1.1392 - 1 August low - Strong
EURUSD: fundamental overview

The euro is stabilizing amid mixed economic signals, with recent retail sales in the Eurozone dropping sharply by 0.5% in July 2025, driven by declines in food and fuel sales, while the construction sector continues to contract despite slight improvements. European stocks have shown resilience, with gains in technology shares, though concerns linger over fiscal challenges, political risks in France, and persistent pessimism in the construction sector. The European Central Bank is likely to maintain steady interest rates, contrasting with expected Federal Reserve rate cuts, putting pressure on the euro, especially as markets await the critical US Nonfarm Payrolls report, which could influence direction.

 
USDJPY: technical overview

There are signs of a meaningful top in place after the market put in a multi-year high in 2024. At this point, the door is now open for a deeper setback below the 2024 low at 139.58, exposing a retest of the 2023 low. Rallies should be well capped below 152.00.

USDJPY Chart
R2 150.92 - 1 August high - Strong
R1 149.14 - 3 September high - Medium
S1 146.21 - 14 August low - Medium
S2 145.85 - 24 July low - Strong
USDJPY: fundamental overview

The Nikkei 225 Index surged, and the Topix Index rose, driven by a tech-led rally mirroring Wall Street, with strong performances from companies like SoftBank and Advantest. Japan’s 10-year bond yield dipped to 1.58% after hitting a 17-year high, while robust wage growth of 4.1% in July and rising household spending supported expectations of a potential Bank of Japan rate hike. Japan’s foreign reserves hit $1.32 trillion, bolstered by valuation effects, and lower US tariffs on Japanese autos, alongside $550 billion in investment, eased pressure on the auto sector. Political uncertainty grew with the resignation of a key ally of Prime Minister Ishiba, potentially impacting BOJ policy, while the yen remained stable against the dollar.

 
AUDUSD: technical overview

There are signs of the potential formation of a longer-term base with the market trading down into a meaningful longer-term support zone. Only a monthly close below 0.5500 would give reason for rethink. A monthly close back above 0.7000 will take the big picture pressure off the downside and strengthen case for a bottom.

AUDUSD Chart
R2 0.6600 - Figure - Medium
R1 0.6569 - 14 August high - Medium
S1 0.6414 - 22 August low - Medium
S1 0.6373 - 23 June low - Strong
AUDUSD: fundamental overview

The Australian dollar is under pressure despite strong domestic economic data, largely due to a resilient U.S. dollar as markets await the U.S. Nonfarm Payrolls report. Australia’s trade surplus surged to A$7.31 billion in July, driven by robust exports and weaker imports, while household spending rose 5.1% year-on-year, supported by solid GDP growth of 0.6% in the June quarter. Despite these positives, the Reserve Bank of Australia is likely to maintain current interest rates, though analysts predict potential rate cuts in 2025 and 2026. The S&P/ASX 200 rallied, led by strong performances in financials and mining stocks.

 
Suggested reading

The Ugly History Of Government Meddling In Business, K. Pringle, Barron’s (September 3, 2025)

Bonds are a disaster. Why you may want to buy more, B. Arends, MarketWatch (September 4, 2025)


Any opinions, news, research, analyses, prices or other information ("information") contained on this Blog, constitutes marketing communication and it has not been prepared in accordance with legal requirements designed to promote the independence of investment research. Further, the information contained within this Blog does not contain (and should not be construed as containing) investment advice or an investment recommendation, or an offer of, or solicitation for, a transaction in any financial instrument. LMAX Group has not verified the accuracy or basis-in-fact of any claim or statement made by any third parties as comments for every Blog entry.

LMAX Group will not accept liability for any loss or damage, including without limitation to, any loss of profit, which may arise directly or indirectly from use of or reliance on such information. No representation or warranty is given as to the accuracy or completeness of the above information. While the produced information was obtained from sources deemed to be reliable, LMAX Group does not provide any guarantees about the reliability of such sources. Consequently any person acting on it does so entirely at his or her own risk. It is not a place to slander, use unacceptable language or to promote LMAX Group or any other FX and CFD provider and any such postings, excessive or unjust comments and attacks will not be allowed and will be removed from the site immediately.

Day Image
4th September 2025 | view in browser
Fed signals cuts amid labor concerns

Long-end Treasury yields dropped sharply after failing to break 5%, triggered by weaker-than-expected US job openings data that heightened concerns about the labor market.


Performance chart 30day v. USD (%)
Performance Chart
 
 
Technical & fundamental highlights
EURUSD: technical overview

The Euro has broken out from a multi-month consolidation off a critical longer-term low. This latest push through the 2023 high (1.1276) lends further support to the case for a meaningful bottom, setting the stage for a bullish structural shift and the next major upside extension targeting the 2021 high at 1.2350. Setbacks should be exceptionally well supported ahead of 1.1000.

EURUSD Chart
R2 1.1789 - 24 July high - Medium
R1 1.1743 - 22 August high - Medium
S1 1.1583 - 22 August low - Medium
S2 1.1392 - 1 August low - Strong
EURUSD: fundamental overview

The euro is holding remains well supported, most recently on the back of a weakening US dollar after disappointing US jobs data increased expectations for Federal Reserve rate cuts. In Europe, inflation rose slightly to 2.1% in August, reinforcing predictions that the European Central Bank will maintain current interest rates at its upcoming meeting, though ECB officials have differing views on future rate adjustments. European stocks rebounded, with tech and luxury sectors leading gains, but bond markets remain cautious amid fiscal concerns, particularly in France, where political uncertainty looms ahead of a confidence vote. Eurozone economic activity shows modest growth, with manufacturing improving but Germany’s economy facing challenges from stagnating manufacturing and contracting services.

 
USDJPY: technical overview

There are signs of a meaningful top in place after the market put in a multi-year high in 2024. At this point, the door is now open for a deeper setback below the 2024 low at 139.58, exposing a retest of the 2023 low. Rallies should be well capped below 152.00.

USDJPY Chart
R2 150.92 - 1 August high - Strong
R1 149.14 - 3 September high - Medium
S1 146.21 - 14 August low - Medium
S2 145.85 - 24 July low - Strong
USDJPY: fundamental overview

Political uncertainty in Japan, driven by speculation over Prime Minister Shigeru Ishiba’s future and resignations within his party after a poor election performance, is weakening the yen and unsettling financial markets. The Nikkei 225 and Topix indices fell, with the Nikkei down 0.88% and Topix down 1.07%, while bond yields hit near-record highs amid fears of increased fiscal spending. Despite a meeting between Ishiba and Bank of Japan Governor Kazuo Ueda temporarily strengthening the yen, the BOJ’s monetary policy remains unchanged, with rates expected to stay at 0.5% at the next meeting. Upcoming wage data and potential leadership changes, including a possible successor favoring low rates, add further complexity to Japan’s economic outlook.

 
AUDUSD: technical overview

There are signs of the potential formation of a longer-term base with the market trading down into a meaningful longer-term support zone. Only a monthly close below 0.5500 would give reason for rethink. A monthly close back above 0.7000 will take the big picture pressure off the downside and strengthen case for a bottom.

AUDUSD Chart
R2 0.6600 - Figure - Medium
R1 0.6569 - 14 August high - Medium
S1 0.6414 - 22 August low - Medium
S1 0.6373 - 23 June low - Strong
AUDUSD: fundamental overview

The Australian dollar remained stable, supported by stronger-than-expected economic growth of 0.6% in Q2, surpassing forecasts and driven by increased household spending. Despite this, the S&P/ASX 200 fell 1.8%, with financials and tech stocks leading the decline. Robust growth has led markets to scale back expectations for Reserve Bank of Australia rate cuts, with a quarter-point cut still anticipated in November, while bond yields rose to a one-and-a-half-month high. RBA Governor Michele Bullock highlighted rising consumer spending due to easing inflation and higher house prices but noted global trade uncertainties, particularly U.S. tariffs, as a concern. Sustaining growth may hinge on improving productivity, which remains low at 0.2% annually, challenging the RBA’s inflation target.

 
Suggested reading

A Comical Sound of Silence About Yield Curve, J. Calhoun, Alhambra (September 1, 2025)

7 Reasons to Stop Freaking Out Over the Fed, D. Lefkovitz, Morningstar (September 3, 2025)


Any opinions, news, research, analyses, prices or other information ("information") contained on this Blog, constitutes marketing communication and it has not been prepared in accordance with legal requirements designed to promote the independence of investment research. Further, the information contained within this Blog does not contain (and should not be construed as containing) investment advice or an investment recommendation, or an offer of, or solicitation for, a transaction in any financial instrument. LMAX Group has not verified the accuracy or basis-in-fact of any claim or statement made by any third parties as comments for every Blog entry.

LMAX Group will not accept liability for any loss or damage, including without limitation to, any loss of profit, which may arise directly or indirectly from use of or reliance on such information. No representation or warranty is given as to the accuracy or completeness of the above information. While the produced information was obtained from sources deemed to be reliable, LMAX Group does not provide any guarantees about the reliability of such sources. Consequently any person acting on it does so entirely at his or her own risk. It is not a place to slander, use unacceptable language or to promote LMAX Group or any other FX and CFD provider and any such postings, excessive or unjust comments and attacks will not be allowed and will be removed from the site immediately.

Day Image
3rd September 2025 | view in browser
Dollar roars back, gold to fresh record high

The FX market experienced a wild day on Tuesday as the U.S. dollar regained strength on return from the US long weekend. Volatility surged with the dollar rising against G10 currencies, equities and bonds declining, and gold hitting a record high.


Performance chart 30day v. USD (%)
Performance Chart
 
 
Technical & fundamental highlights
EURUSD: technical overview

The Euro has broken out from a multi-month consolidation off a critical longer-term low. This latest push through the 2023 high (1.1276) lends further support to the case for a meaningful bottom, setting the stage for a bullish structural shift and the next major upside extension targeting the 2021 high at 1.2350. Setbacks should be exceptionally well supported ahead of 1.1000.

EURUSD Chart
R2 1.1789 - 24 July high - Medium
R1 1.1743 - 22 August high - Medium
S1 1.1583 - 22 August low - Medium
S2 1.1392 - 1 August low - Strong
EURUSD: fundamental overview

The euro dipped toward $1.16 as European bond yields surged, driven by fiscal concerns reminiscent of the 2011 eurozone debt crisis, with German and French 30-year yields hitting decade highs. Germany plans €500 billion in new borrowing by 2029 for infrastructure and defense, while France faces a growing debt burden ahead of a key confidence vote. Eurozone inflation rose to 2.1% in August, above the ECB’s 2% target, fueling expectations of steady interest rates, while European stock markets, especially banks and tech, fell sharply amid global selloffs.

 
USDJPY: technical overview

There are signs of a meaningful top in place after the market put in a multi-year high in 2024. At this point, the door is now open for a deeper setback below the 2024 low at 139.58, exposing a retest of the 2023 low. Rallies should be well capped below 152.00.

USDJPY Chart
R2 150.92 - 1 August high - Strong
R1 148.95 - 2 September high - Medium
S1 146.21 - 14 August low - Medium
S2 145.85 - 24 July low - Strong
USDJPY: fundamental overview

The Yen has come under pressure in recent sessions, driven by political uncertainty in Japan that’s weakening the yen, with former Prime Minister Aso Taro reportedly pushing for a new Liberal Democratic Party leadership election, pressuring Prime Minister Shigeru Ishiba. The Bank of Japan’s Deputy Governor Ryozo Himino reiterated gradual rate hikes but avoided specific timing, lowering market expectations for a year-end hike. In the US, a court ruling declared Trump’s “reciprocal” tariffs illegal, with an appeal deadline looming, adding uncertainty to the dollar. Japan’s economy grew steadily in August, with the services sector driving the Composite PMI to 52.0, though export orders dropped sharply and inflation eased, with businesses cautious on hiring and price increases.

 
AUDUSD: technical overview

There are signs of the potential formation of a longer-term base with the market trading down into a meaningful longer-term support zone. Only a monthly close below 0.5500 would give reason for rethink. A monthly close back above 0.7000 will take the big picture pressure off the downside and strengthen case for a bottom.

AUDUSD Chart
R2 0.6600 - Figure - Medium
R1 0.6569 - 14 August high - Medium
S1 0.6414 - 22 August low - Medium
S1 0.6373 - 23 June low - Strong
AUDUSD: fundamental overview

The Australian dollar ended a five-session rally as markets grappled with mixed economic signals. While Q2 2025 showed a smaller-than-expected current account deficit and manufacturing hit a near three-year high, other indicators like a contracting Ai Group Industry Index and a drop in dwelling approvals painted a less rosy picture. The S&P/ASX 200 fell 0.3% to a two-week low, reflecting uncertainty, while rising bond yields and steady job ads reduced expectations for near-term rate cuts. Attention now turns to Australia’s Q2 GDP data and an upcoming speech by RBA Governor Michele Bullock for clues on future monetary policy.

 
Suggested reading

Technology and demographics are driving the uptake of medical robots, M. Peel, Financial Times (September 2, 2025)

Ken Griffin On Markets, Fed, Building the Tomorrow’s Citadel, A. Serwer, Barron’s (August 29, 2025)


Any opinions, news, research, analyses, prices or other information ("information") contained on this Blog, constitutes marketing communication and it has not been prepared in accordance with legal requirements designed to promote the independence of investment research. Further, the information contained within this Blog does not contain (and should not be construed as containing) investment advice or an investment recommendation, or an offer of, or solicitation for, a transaction in any financial instrument. LMAX Group has not verified the accuracy or basis-in-fact of any claim or statement made by any third parties as comments for every Blog entry.

LMAX Group will not accept liability for any loss or damage, including without limitation to, any loss of profit, which may arise directly or indirectly from use of or reliance on such information. No representation or warranty is given as to the accuracy or completeness of the above information. While the produced information was obtained from sources deemed to be reliable, LMAX Group does not provide any guarantees about the reliability of such sources. Consequently any person acting on it does so entirely at his or her own risk. It is not a place to slander, use unacceptable language or to promote LMAX Group or any other FX and CFD provider and any such postings, excessive or unjust comments and attacks will not be allowed and will be removed from the site immediately.

Day Image
2nd September 2025 | view in browser
Trump admin eyes housing emergency

The Trump administration, through Treasury Secretary Bessent, is considering declaring a national housing emergency this fall to tackle the ongoing housing affordability crisis, a move not seen since the 2008 financial crisis.


Performance chart 30day v. USD (%)
Performance Chart
 
 
Technical & fundamental highlights
EURUSD: technical overview

The Euro has broken out from a multi-month consolidation off a critical longer-term low. This latest push through the 2023 high (1.1276) lends further support to the case for a meaningful bottom, setting the stage for a bullish structural shift and the next major upside extension targeting the 2021 high at 1.2350. Setbacks should be exceptionally well supported ahead of 1.1000.

EURUSD Chart
R2 1.1789 - 24 July high - Medium
R1 1.1743 - 22 August high - Medium
S1 1.1583 - 22 August low - Medium
S2 1.1392 - 1 August low - Strong
EURUSD: fundamental overview

The euro rose above $1.17 in early September, driven by a weak dollar amid expectations of Federal Reserve rate cuts and ongoing U.S. political uncertainty. European stocks gained slightly, with defense stocks like Rheinmetall surging due to potential EU military plans for Ukraine, while Novo Nordisk rose on positive drug trial data. Economic indicators showed resilience, with Eurozone unemployment at a record low of 6.2%, manufacturing PMI hitting 50.7, and Germany’s PMI nearing expansion at 49.8. Trade talks persist despite legal challenges to U.S. tariffs, and bond markets remain tense with Germany’s 10-year yield above 2.7%. Eurozone inflation data, expected to show a slight uptick, is unlikely to shift the ECB’s easing path as trade tensions take center stage.

 
USDJPY: technical overview

There are signs of a meaningful top in place after the market put in a multi-year high in 2024. At this point, the door is now open for a deeper setback below the 2024 low at 139.58, exposing a retest of the 2023 low. Rallies should be well capped below 152.00.

USDJPY Chart
R2 150.92 - 1 August high - Strong
R1 148.52 - 12 August high - Medium
S1 146.21 - 14 August low - Medium
S2 145.85 - 24 July low - Strong
USDJPY: fundamental overview

Japan’s economy shows mixed signals: corporate capital spending surged 7.6% in Q2, exceeding expectations, but manufacturing weakened, with the August PMI at 49.7, signaling continued contraction. Despite this, rising wages and persistent inflation fuel expectations of a Bank of Japan rate hike by year-end. The Nikkei and Topix indices fell 1.24% and 0.39% respectively on Monday, driven by tech stock losses, though both later edged up 0.2%. Elevated bond yields, with the 10-year JGB at a 17-year high of 1.6%, and a cautious bond market ahead of a key auction and BOJ Deputy Governor Himino’s speech, add uncertainty. Japan’s monetary base also shrank 4.1% year-on-year to JPY 645.6 trillion in August, continuing a seven-month decline.

 
AUDUSD: technical overview

There are signs of the potential formation of a longer-term base with the market trading down into a meaningful longer-term support zone. Only a monthly close below 0.5500 would give reason for rethink. A monthly close back above 0.7000 will take the big picture pressure off the downside and strengthen case for a bottom.

AUDUSD Chart
R2 0.6600 - Figure - Medium
R1 0.6569 - 14 August high - Medium
S1 0.6414 - 22 August low - Medium
S1 0.6373 - 23 June low - Strong
AUDUSD: fundamental overview

The Australian dollar has surged to a two-week high, bolstered by a robust manufacturing sector, with the Manufacturing PMI hitting a near three-year high of 53 in August. Despite mixed economic signals, including a modest job market recovery and a sharp 8.2% drop in total dwelling approvals, the currency is supported by a weaker US dollar and rising bond yields, with Australia’s 10-year ACGB yield at 4.34%. However, the stock market saw declines, with the S&P/ASX 200 falling 0.5%, and economic growth concerns persist as Q2 GDP forecasts suggest a slowdown to 1.7%. Net exports are expected to detract slightly from growth, with a projected current account deficit of A$16 billion, driven by weak services exports and a structural income deficit.

 
Suggested reading

In Jackson Hole, Fed Undid Its Biggest Framework, Fisher Investments (August 27, 2025)

Buffett’s Bearishness Tramples on the ‘Money Multiplier’ Myth, J. Tamny, Forbes (August 31, 2025)


Any opinions, news, research, analyses, prices or other information ("information") contained on this Blog, constitutes marketing communication and it has not been prepared in accordance with legal requirements designed to promote the independence of investment research. Further, the information contained within this Blog does not contain (and should not be construed as containing) investment advice or an investment recommendation, or an offer of, or solicitation for, a transaction in any financial instrument. LMAX Group has not verified the accuracy or basis-in-fact of any claim or statement made by any third parties as comments for every Blog entry.

LMAX Group will not accept liability for any loss or damage, including without limitation to, any loss of profit, which may arise directly or indirectly from use of or reliance on such information. No representation or warranty is given as to the accuracy or completeness of the above information. While the produced information was obtained from sources deemed to be reliable, LMAX Group does not provide any guarantees about the reliability of such sources. Consequently any person acting on it does so entirely at his or her own risk. It is not a place to slander, use unacceptable language or to promote LMAX Group or any other FX and CFD provider and any such postings, excessive or unjust comments and attacks will not be allowed and will be removed from the site immediately.

Day Image
29th August 2025 | view in browser
Dollar dips as GDP beats, Fed drama heats up

The U.S. dollar remained under pressure on Thursday despite positive economic data, including a stronger-than-expected Q2 GDP growth of 3.3% and lower jobless claims of 229,000.


Performance chart 30day v. USD (%)
Performance Chart
 
 
Technical & fundamental highlights
EURUSD: technical overview

The Euro has broken out from a multi-month consolidation off a critical longer-term low. This latest push through the 2023 high (1.1276) lends further support to the case for a meaningful bottom, setting the stage for a bullish structural shift and the next major upside extension targeting the 2021 high at 1.2350. Setbacks should be exceptionally well supported ahead of 1.1000.

EURUSD Chart
R2 1.1789 - 24 July high - Medium
R1 1.1743 - 22 August high - Medium
S1 1.1583 - 22 August low - Medium
S2 1.1392 - 1 August low - Strong
EURUSD: fundamental overview

Fed Chair Powell’s hint at a September rate cut and looming US tariffs on European goods (excluding autos, pharmaceuticals, and chips) highlight policy and trade divergences. In the Eurozone, consumer confidence dipped to a four-month low of -15.5, and economic sentiment fell to 95.2, driven by weaker services and construction sectors, while bank lending grew steadily. Political uncertainty in France, with Prime Minister Bayrou facing a likely defeat in a confidence vote, adds market tension, and ECB divisions on inflation risks signal caution despite stable rates and rising German and French bond yields. European stocks showed mixed results, with tech stocks volatile after Nvidia’s earnings and broader concerns about AI-driven market sustainability.

 
USDJPY: technical overview

There are signs of a meaningful top in place after the market put in a multi-year high in 2024. At this point, the door is now open for a deeper setback below the 2024 low at 139.58, exposing a retest of the 2023 low. Rallies should be well capped below 152.00.

USDJPY Chart
R2 150.92 - 1 August high - Strong
R1 148.52 - 12 August high - Medium
S1 146.21 - 14 August low - Medium
S2 145.85 - 24 July low - Strong
USDJPY: fundamental overview

Japan’s yen strengthened amid mixed economic data. Tokyo’s core consumer prices rose 2.5% in August 2025, above the Bank of Japan’s 2% target, signaling potential for further rate hikes despite a pause due to U.S. tariff concerns. The unemployment rate fell to 2.3% in July, the lowest since December 2019, while industrial production dropped sharply by 1.6% and retail sales growth slowed to 0.3%, the weakest since February 2022. Japan’s 10-year bond yield neared a 17-year high at 1.62%.

 
AUDUSD: technical overview

There are signs of the potential formation of a longer-term base with the market trading down into a meaningful longer-term support zone. Only a monthly close below 0.5500 would give reason for rethink. A monthly close back above 0.7000 will take the big picture pressure off the downside and strengthen case for a bottom.

AUDUSD Chart
R2 0.6600 - Figure - Medium
R1 0.6569 - 14 August high - Medium
S1 0.6414 - 22 August low - Medium
S1 0.6373 - 23 June low - Strong
AUDUSD: fundamental overview

The Australian dollar rose for the third consecutive day as higher-than-expected July inflation data reduced expectations for an imminent RBA rate cut, with markets now anticipating only 34 basis points of easing in 2025 and a possible cut in November. A weaker US dollar, driven by increased bets on a September Fed rate cut and political uncertainty surrounding Fed Governor Lisa Cook, further supported the Aussie dollar. Domestically, strong business investment and a 0.2% rise in the S&P/ASX 200, led by financial and defensive sectors, bolstered market sentiment, though energy and healthcare stocks lagged due to weaker oil prices and disappointing earnings.

 
Suggested reading

Attempting To Make Banks Big By Decree, J. Tamny, Forbes (August 26, 2025)

It’s 1995 for AI, S. McBride, Risk Hedge (August 25, 2025)


Any opinions, news, research, analyses, prices or other information ("information") contained on this Blog, constitutes marketing communication and it has not been prepared in accordance with legal requirements designed to promote the independence of investment research. Further, the information contained within this Blog does not contain (and should not be construed as containing) investment advice or an investment recommendation, or an offer of, or solicitation for, a transaction in any financial instrument. LMAX Group has not verified the accuracy or basis-in-fact of any claim or statement made by any third parties as comments for every Blog entry.

LMAX Group will not accept liability for any loss or damage, including without limitation to, any loss of profit, which may arise directly or indirectly from use of or reliance on such information. No representation or warranty is given as to the accuracy or completeness of the above information. While the produced information was obtained from sources deemed to be reliable, LMAX Group does not provide any guarantees about the reliability of such sources. Consequently any person acting on it does so entirely at his or her own risk. It is not a place to slander, use unacceptable language or to promote LMAX Group or any other FX and CFD provider and any such postings, excessive or unjust comments and attacks will not be allowed and will be removed from the site immediately.

Day Image
27th August 2025 | view in browser
Trump’s Fed shake-up weakens Dollar

The U.S. dollar weakened in late trading as falling front-end rates reflected market expectations of a dovish Federal Reserve appointment under the Trump administration, with NEC Director Kevin Hassett suggesting Governor Cook may resign before the September meeting, potentially replaced by David Malpass.


Performance chart 30day v. USD (%)
Performance Chart
 
 
Technical & fundamental highlights
EURUSD: technical overview

The Euro has broken out from a multi-month consolidation off a critical longer-term low. This latest push through the 2023 high (1.1276) lends further support to the case for a meaningful bottom, setting the stage for a bullish structural shift and the next major upside extension targeting the 2021 high at 1.2350. Setbacks should be exceptionally well supported ahead of 1.1000.

EURUSD Chart
R2 1.1789 - 24 July high - Medium
R1 1.1743 - 22 August high - Medium
S1 1.1583 - 22 August low - Medium
S2 1.1392 - 1 August low - Strong
EURUSD: fundamental overview

The euro hovers below its July four-year high as the ECB signals a pause in rate cuts, citing strong labor markets and German business morale reaching a 15-month peak, contrasting with the Fed’s expected September easing. European bond yields, like Germany’s 10-year at 2.75% and France’s at 3.51%, rose amid fiscal concerns and reduced ECB cut expectations, while European stocks, led by semiconductors, saw modest gains. Trade tensions with the U.S. persist, with the EU planning to remove tariffs on U.S. goods in response to Trump’s demands. Upcoming Eurozone confidence data and Switzerland’s Q2 GDP, expected to slow to 0.1%, highlight diverging U.S.-Europe economic paths, likely shaping markets through 2025.

 
USDJPY: technical overview

There are signs of a meaningful top in place after the market put in a multi-year high in 2024. At this point, the door is now open for a deeper setback below the 2024 low at 139.58, exposing a retest of the 2023 low. Rallies should be well capped below 152.00.

USDJPY Chart
R2 150.92 - 1 August high - Strong
R1 148.52 - 12 August high - Medium
S1 146.21 - 14 August low - Medium
S2 145.85 - 24 July low - Strong
USDJPY: fundamental overview

The Japanese yen remained stable as investors awaited key economic data, particularly Tokyo’s inflation report, which could support further Bank of Japan rate hikes. Economists predict the “core-core” CPI will rise to 3.2%, driven by higher food and dining costs, while BOJ Governor Ueda’s hawkish comments signal confidence in sustained wage growth and inflation, potentially leading to an October rate increase. Japanese bond yields hit a 17-year high, reflecting these expectations, but market caution persists due to U.S. political uncertainties, including President Trump’s dismissal of Fed Governor Lisa Cook, raising concerns about central bank independence. The Nikkei 225 gained slightly, led by semiconductor stocks, while upcoming economic data will shape the yen’s trajectory and BOJ policy outlook.

 
AUDUSD: technical overview

There are signs of the potential formation of a longer-term base with the market trading down into a meaningful longer-term support zone. Only a monthly close below 0.5500 would give reason for rethink. A monthly close back above 0.7000 will take the big picture pressure off the downside and strengthen case for a bottom.

AUDUSD Chart
R2 0.6600 - Figure - Medium
R1 0.6569 - 14 August high - Medium
S1 0.6414 - 22 August low - Medium
S1 0.6373 - 23 June low - Strong
AUDUSD: fundamental overview

The Australian dollar remained stable despite unexpectedly high inflation data, with July consumer prices rising to 2.8% year-on-year, surpassing forecasts of 2.3% and June’s 1.9%. Core inflation also climbed to 2.7%, complicating the Reserve Bank of Australia’s policy outlook, though markets still anticipate a rate cut in November due to the volatile nature of monthly inflation data. Australian bond yields rose, with the 10-year yield hitting 4.33%, reflecting the inflation surprise, while the RBA’s recent minutes suggested openness to rate cuts if inflation eases, creating uncertainty about future policy decisions.

 
Suggested reading

Attempting To Make Banks Big By Decree, J. Tamny, Forbes (August 26, 2025)

It’s 1995 for AI, S. McBride, Risk Hedge (August 25, 2025)


Any opinions, news, research, analyses, prices or other information ("information") contained on this Blog, constitutes marketing communication and it has not been prepared in accordance with legal requirements designed to promote the independence of investment research. Further, the information contained within this Blog does not contain (and should not be construed as containing) investment advice or an investment recommendation, or an offer of, or solicitation for, a transaction in any financial instrument. LMAX Group has not verified the accuracy or basis-in-fact of any claim or statement made by any third parties as comments for every Blog entry.

LMAX Group will not accept liability for any loss or damage, including without limitation to, any loss of profit, which may arise directly or indirectly from use of or reliance on such information. No representation or warranty is given as to the accuracy or completeness of the above information. While the produced information was obtained from sources deemed to be reliable, LMAX Group does not provide any guarantees about the reliability of such sources. Consequently any person acting on it does so entirely at his or her own risk. It is not a place to slander, use unacceptable language or to promote LMAX Group or any other FX and CFD provider and any such postings, excessive or unjust comments and attacks will not be allowed and will be removed from the site immediately.

Day Image
26th August 2025 | view in browser
Dollar dips amid Fed drama

The U.S. dollar weakened on Tuesday despite positive consumer confidence and durable goods data, as markets focused on President Trump’s controversial attempt to remove Federal Reserve Governor Lisa Cook, following his announcement on Truth Social.


Performance chart 30day v. USD (%)
Performance Chart
 
 
Technical & fundamental highlights
EURUSD: technical overview

The Euro has broken out from a multi-month consolidation off a critical longer-term low. This latest push through the 2023 high (1.1276) lends further support to the case for a meaningful bottom, setting the stage for a bullish structural shift and the next major upside extension targeting the 2021 high at 1.2350. Setbacks should be exceptionally well supported ahead of 1.1000.

EURUSD Chart
R2 1.1789 - 24 July high - Medium
R1 1.1743 - 22 August high - Medium
S1 1.1583 - 22 August low - Medium
S2 1.1392 - 1 August low - Strong
EURUSD: fundamental overview

The European Central Bank is maintaining a cautious “wait-and-see” approach, holding interest rates steady at 2.15% for main refinancing and 2% for the deposit facility, with inflation at the 2% target and likely to dip lower due to a strong euro and falling energy prices. In contrast, the U.S. Federal Reserve is adopting a more dovish stance, which may support the euro’s strength in the near term. However, political turmoil in France, where the government faces a potential collapse due to opposition to budget cuts and tax increases, could undermine eurozone stability and pressure the euro if borrowing costs rise significantly. Despite these risks, ECB President Lagarde remains optimistic about resilient euro-area growth and minimal impact from U.S. tariffs, while historical trends suggest French political volatility may have short-lived market effects.

 
USDJPY: technical overview

There are signs of a meaningful top in place after the market put in a multi-year high in 2024. At this point, the door is now open for a deeper setback below the 2024 low at 139.58, exposing a retest of the 2023 low. Rallies should be well capped below 152.00.

USDJPY Chart
R2 150.92 - 1 August high - Strong
R1 148.52 - 12 August high - Medium
S1 146.21 - 14 August low - Medium
S2 145.85 - 24 July low - Strong
USDJPY: fundamental overview

Tokyo’s August inflation data, a key indicator of Japan’s nationwide trends, is expected to dip slightly due to temporary energy subsidies, though the core-core inflation rate (excluding fresh food and energy) should remain high at around 3.0% year-on-year. This supports expectations for a Bank of Japan rate hike, with traders now pricing in a 43% chance of an October hike, bolstered by the BOJ’s hawkish outlook and narrowing U.S.-Japan yield spreads. Prime Minister Shigeru Ishiba’s rising approval ratings (57.5%) suggest growing political stability, potentially reinforcing the BOJ’s normalization path, though a record JPY 32.4 trillion debt financing request could complicate further rate hikes due to fiscal constraints.

 
AUDUSD: technical overview

There are signs of the potential formation of a longer-term base with the market trading down into a meaningful longer-term support zone. Only a monthly close below 0.5500 would give reason for rethink. A monthly close back above 0.7000 will take the big picture pressure off the downside and strengthen case for a bottom.

AUDUSD Chart
R2 0.6600 - Figure - Medium
R1 0.6569 - 14 August high - Medium
S1 0.6414 - 22 August low - Medium
S1 0.6373 - 23 June low - Strong
AUDUSD: fundamental overview

The Reserve Bank of Australia’s August meeting minutes suggest more interest rate cuts are likely in the coming year to achieve inflation and employment targets, with markets expecting at least two cuts by early 2026. The Australian dollar may face downward pressure against the US Dollar, but long-term AUDUSD gains are supported by China’s stimulus measures, which boost demand for Australian commodities, and concerns over the USD’s credibility due to U.S. political and policy uncertainties. Upcoming Australian CPI data and China’s industrial profits report could influence RBA’s next steps, with analysts anticipating no rate cut in September but potential cuts in November 2025 and February 2026.

 
Suggested reading

Powell Mimicked ‘Three-Armed Economist’ In JH, J. Calhoun, Alhambra (August 25, 2025)

Powell Gives the Market What It Wants, Not What It Needs, R. Forsyth, Barron’s (August 22, 2025)


Any opinions, news, research, analyses, prices or other information ("information") contained on this Blog, constitutes marketing communication and it has not been prepared in accordance with legal requirements designed to promote the independence of investment research. Further, the information contained within this Blog does not contain (and should not be construed as containing) investment advice or an investment recommendation, or an offer of, or solicitation for, a transaction in any financial instrument. LMAX Group has not verified the accuracy or basis-in-fact of any claim or statement made by any third parties as comments for every Blog entry.

LMAX Group will not accept liability for any loss or damage, including without limitation to, any loss of profit, which may arise directly or indirectly from use of or reliance on such information. No representation or warranty is given as to the accuracy or completeness of the above information. While the produced information was obtained from sources deemed to be reliable, LMAX Group does not provide any guarantees about the reliability of such sources. Consequently any person acting on it does so entirely at his or her own risk. It is not a place to slander, use unacceptable language or to promote LMAX Group or any other FX and CFD provider and any such postings, excessive or unjust comments and attacks will not be allowed and will be removed from the site immediately.

Day Image
25th August 2025 | view in browser
Political turmoil in France pressures Euro

The euro faced significant pressure on Monday due to political uncertainty in France, where Prime Minister François Bayrou called for a confidence vote on September 8 to support his government’s unpopular debt reduction plan, risking its collapse after just nine months.


Performance chart 30day v. USD (%)
Performance Chart
 
 
Technical & fundamental highlights
EURUSD: technical overview

The Euro has broken out from a multi-month consolidation off a critical longer-term low. This latest push through the 2023 high (1.1276) lends further support to the case for a meaningful bottom, setting the stage for a bullish structural shift and the next major upside extension targeting the 2021 high at 1.2350. Setbacks should be exceptionally well supported ahead of 1.1000.

EURUSD Chart
R2 1.1789 - 24 July high - Medium
R1 1.1743 - 22 August high - Medium
S1 1.1583 - 22 August low - Medium
S2 1.1392 - 1 August low - Strong
EURUSD: fundamental overview

The European Central Bank is adopting a cautious “wait-and-see” approach, keeping interest rates steady at 2.15% for main refinancing and 2% for the deposit facility, as inflation hits the 2% target and may dip lower due to a strong euro and falling energy prices. Unlike the U.S. Federal Reserve, which is leaning toward easing, the ECB is hesitant to cut rates further unless growth or inflation weakens significantly, with markets expecting minimal chance of a cut before year-end. Recent data shows the eurozone economy, particularly Germany, displaying modest growth and resilience, with the German IFO business climate index rising to 89.0 in August, the highest since 2023, despite ongoing structural challenges and trade disruptions. ECB officials, including President Christine Lagarde, remain optimistic about steady growth and minimal impact from U.S. tariffs, with no immediate plans for additional rate cuts unless risks materialize.

 
USDJPY: technical overview

There are signs of a meaningful top in place after the market put in a multi-year high in 2024. At this point, the door is now open for a deeper setback below the 2024 low at 139.58, exposing a retest of the 2023 low. Rallies should be well capped below 152.00.

USDJPY Chart
R2 150.92 - 1 August high - Strong
R1 148.52 - 12 August high - Medium
S1 146.21 - 14 August low - Medium
S2 145.85 - 24 July low - Strong
USDJPY: fundamental overview

At the Jackson Hole symposium, Bank of Japan Governor Kazuo Ueda expressed confidence that Japan’s tight labor market will drive wage growth and sustain inflation, citing demographic constraints as a key factor for medium-term inflation stickiness. Despite core inflation at 3.1%, Ueda remained cautious, noting it’s still below the BOJ’s target, though markets are increasingly expecting a rate hike by October, with odds rising above 42%. Upcoming Tokyo inflation data and other economic indicators could further support these expectations, while narrowing U.S.-Japan yield spreads and a dovish Fed shift may pressure the USDJPY exchange rate. Meanwhile, Prime Minister Shigeru Ishiba’s rising approval ratings suggest political stability, potentially reinforcing the BOJ’s gradual policy normalization, though weak department store sales and a cooling Services Producer Price Index highlight ongoing challenges for Japan’s retail sector and economic recovery.

 
AUDUSD: technical overview

There are signs of the potential formation of a longer-term base with the market trading down into a meaningful longer-term support zone. Only a monthly close below 0.5500 would give reason for rethink. A monthly close back above 0.7000 will take the big picture pressure off the downside and strengthen case for a bottom.

AUDUSD Chart
R2 0.6600 - Figure - Medium
R1 0.6569 - 14 August high - Medium
S1 0.6414 - 22 August low - Medium
S1 0.6373 - 23 June low - Strong
AUDUSD: fundamental overview

Westpac suggests maintaining long positions in AUDUSD, as factors like China’s economic stimulus and risks to the US dollar’s credibility support a gradual rise in the Australian dollar. China’s policies, including liquidity injections and lower interest rates, boost demand for Australian exports, strengthening the Australian Dollar. Meanwhile, the US dollar faces challenges from political instability and erratic policies. Australia’s upcoming CPI reports, particularly in August, could influence the AUD’s near-term path, but the Reserve Bank of Australia is likely to hold rates steady in September, with potential cuts in November 2025 and February 2026.

 
Suggested reading

If Trump Economy Is “Booming,” Then It Doesn’t Need The Fed, J. Tamny, Forbes (August 24, 2025)

Why the Fed’s Long Pause May Extend the Market Rally, F. Yue, MarketWatch (August 25, 2025)


Any opinions, news, research, analyses, prices or other information ("information") contained on this Blog, constitutes marketing communication and it has not been prepared in accordance with legal requirements designed to promote the independence of investment research. Further, the information contained within this Blog does not contain (and should not be construed as containing) investment advice or an investment recommendation, or an offer of, or solicitation for, a transaction in any financial instrument. LMAX Group has not verified the accuracy or basis-in-fact of any claim or statement made by any third parties as comments for every Blog entry.

LMAX Group will not accept liability for any loss or damage, including without limitation to, any loss of profit, which may arise directly or indirectly from use of or reliance on such information. No representation or warranty is given as to the accuracy or completeness of the above information. While the produced information was obtained from sources deemed to be reliable, LMAX Group does not provide any guarantees about the reliability of such sources. Consequently any person acting on it does so entirely at his or her own risk. It is not a place to slander, use unacceptable language or to promote LMAX Group or any other FX and CFD provider and any such postings, excessive or unjust comments and attacks will not be allowed and will be removed from the site immediately.