


 | ||
| 2nd September 2025 | view in browser | ||
| Trump admin eyes housing emergency | ||
| The Trump administration, through Treasury Secretary Bessent, is considering declaring a national housing emergency this fall to tackle the ongoing housing affordability crisis, a move not seen since the 2008 financial crisis. | ||
| Performance chart 30day v. USD (%) | ||
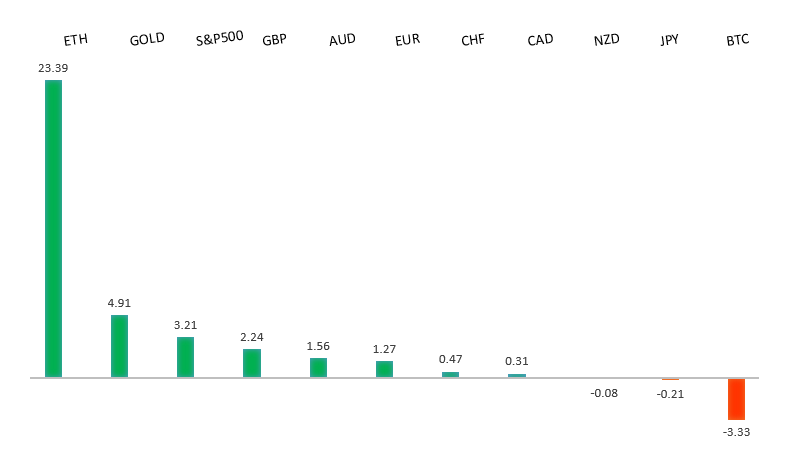 | ||
| Technical & fundamental highlights | ||
| EURUSD: technical overview | ||
| The Euro has broken out from a multi-month consolidation off a critical longer-term low. This latest push through the 2023 high (1.1276) lends further support to the case for a meaningful bottom, setting the stage for a bullish structural shift and the next major upside extension targeting the 2021 high at 1.2350. Setbacks should be exceptionally well supported ahead of 1.1000. | ||
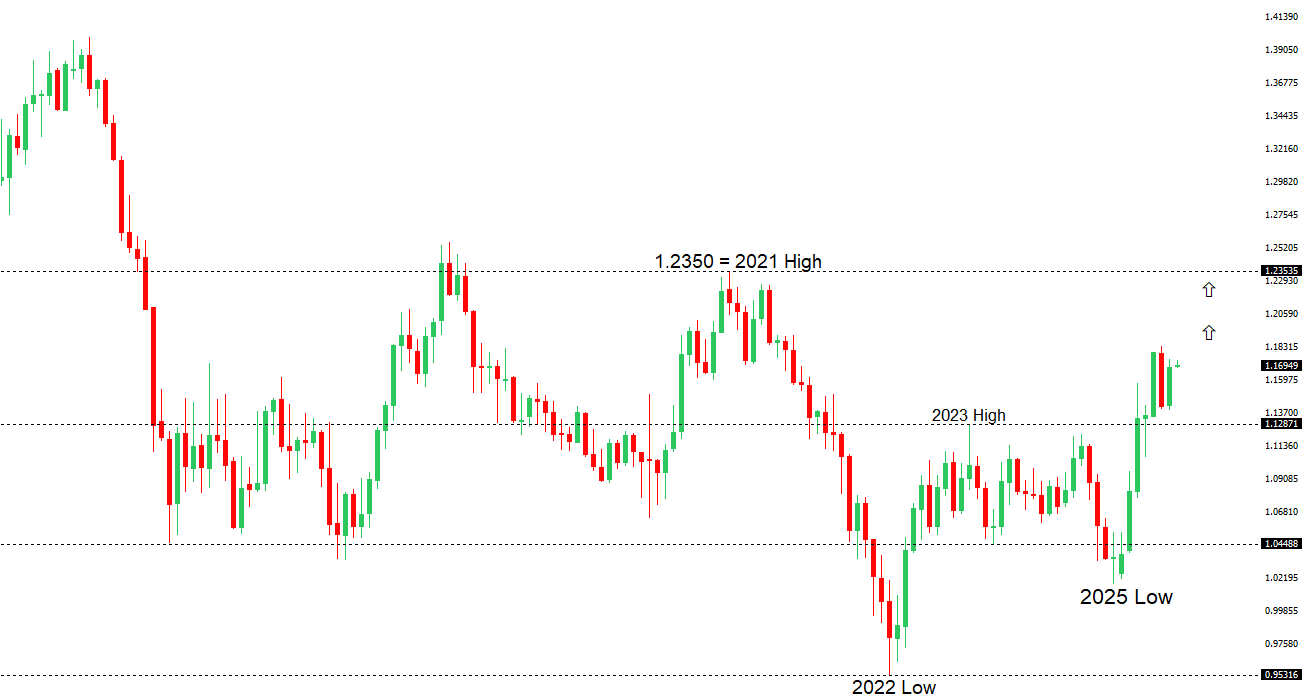 | ||
| R2 1.1789 - 24 July high - Medium R1 1.1743 - 22 August high - Medium S1 1.1583 - 22 August low - Medium S2 1.1392 - 1 August low - Strong | ||
| EURUSD: fundamental overview | ||
| The euro rose above $1.17 in early September, driven by a weak dollar amid expectations of Federal Reserve rate cuts and ongoing U.S. political uncertainty. European stocks gained slightly, with defense stocks like Rheinmetall surging due to potential EU military plans for Ukraine, while Novo Nordisk rose on positive drug trial data. Economic indicators showed resilience, with Eurozone unemployment at a record low of 6.2%, manufacturing PMI hitting 50.7, and Germany’s PMI nearing expansion at 49.8. Trade talks persist despite legal challenges to U.S. tariffs, and bond markets remain tense with Germany’s 10-year yield above 2.7%. Eurozone inflation data, expected to show a slight uptick, is unlikely to shift the ECB’s easing path as trade tensions take center stage. | ||
| USDJPY: technical overview | ||
| There are signs of a meaningful top in place after the market put in a multi-year high in 2024. At this point, the door is now open for a deeper setback below the 2024 low at 139.58, exposing a retest of the 2023 low. Rallies should be well capped below 152.00. | ||
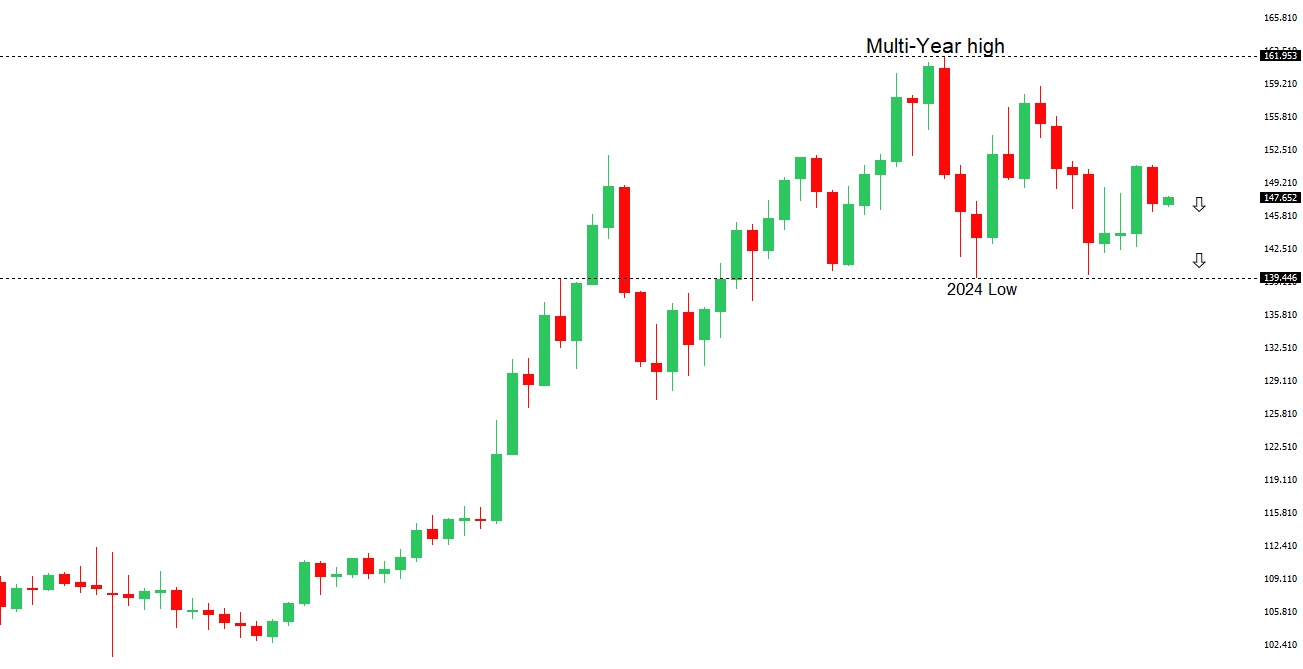 | ||
| R2 150.92 - 1 August high - Strong R1 148.52 - 12 August high - Medium S1 146.21 - 14 August low - Medium S2 145.85 - 24 July low - Strong | ||
| USDJPY: fundamental overview | ||
| Japan’s economy shows mixed signals: corporate capital spending surged 7.6% in Q2, exceeding expectations, but manufacturing weakened, with the August PMI at 49.7, signaling continued contraction. Despite this, rising wages and persistent inflation fuel expectations of a Bank of Japan rate hike by year-end. The Nikkei and Topix indices fell 1.24% and 0.39% respectively on Monday, driven by tech stock losses, though both later edged up 0.2%. Elevated bond yields, with the 10-year JGB at a 17-year high of 1.6%, and a cautious bond market ahead of a key auction and BOJ Deputy Governor Himino’s speech, add uncertainty. Japan’s monetary base also shrank 4.1% year-on-year to JPY 645.6 trillion in August, continuing a seven-month decline. | ||
| AUDUSD: technical overview | ||
| There are signs of the potential formation of a longer-term base with the market trading down into a meaningful longer-term support zone. Only a monthly close below 0.5500 would give reason for rethink. A monthly close back above 0.7000 will take the big picture pressure off the downside and strengthen case for a bottom. | ||
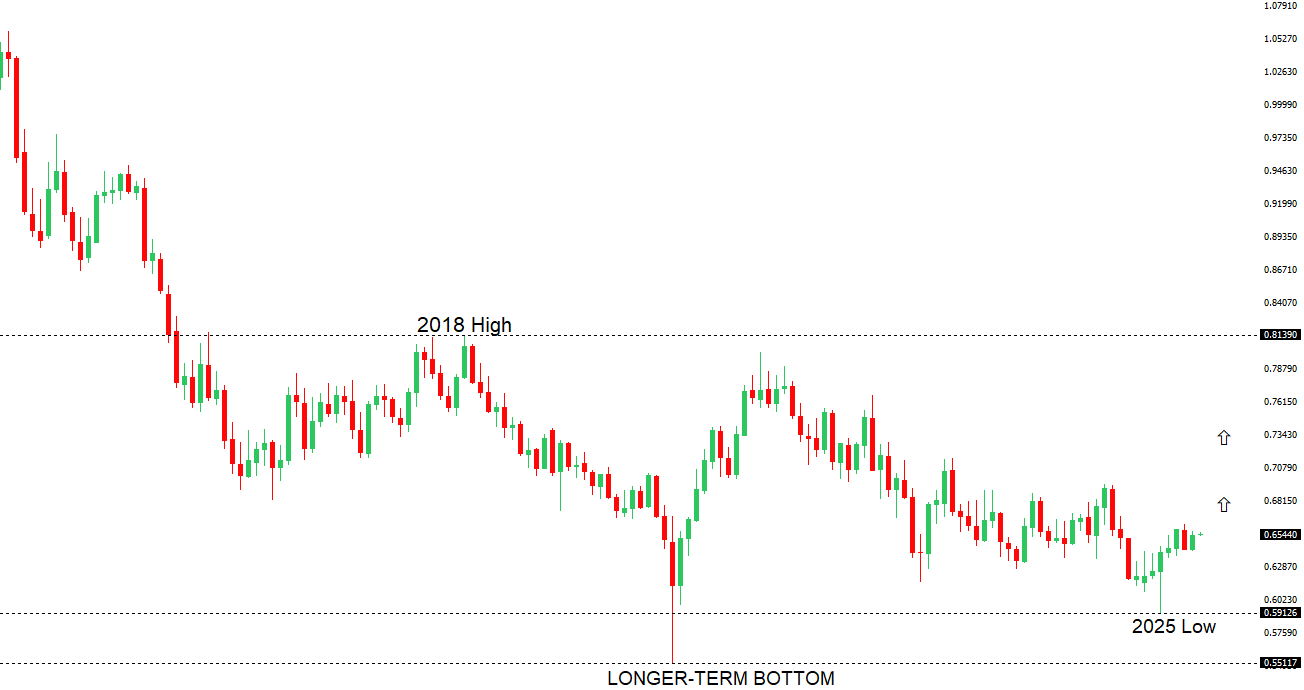 | ||
| R2 0.6600 - Figure - Medium R1 0.6569 - 14 August high - Medium S1 0.6414 - 22 August low - Medium S1 0.6373 - 23 June low - Strong | ||
| AUDUSD: fundamental overview | ||
| The Australian dollar has surged to a two-week high, bolstered by a robust manufacturing sector, with the Manufacturing PMI hitting a near three-year high of 53 in August. Despite mixed economic signals, including a modest job market recovery and a sharp 8.2% drop in total dwelling approvals, the currency is supported by a weaker US dollar and rising bond yields, with Australia’s 10-year ACGB yield at 4.34%. However, the stock market saw declines, with the S&P/ASX 200 falling 0.5%, and economic growth concerns persist as Q2 GDP forecasts suggest a slowdown to 1.7%. Net exports are expected to detract slightly from growth, with a projected current account deficit of A$16 billion, driven by weak services exports and a structural income deficit. | ||
| Suggested reading | ||
| In Jackson Hole, Fed Undid Its Biggest Framework, Fisher Investments (August 27, 2025) Buffett’s Bearishness Tramples on the ‘Money Multiplier’ Myth, J. Tamny, Forbes (August 31, 2025) | ||