


 | ||
| 29th August 2025 | view in browser | ||
| Dollar dips as GDP beats, Fed drama heats up | ||
| The U.S. dollar remained under pressure on Thursday despite positive economic data, including a stronger-than-expected Q2 GDP growth of 3.3% and lower jobless claims of 229,000. | ||
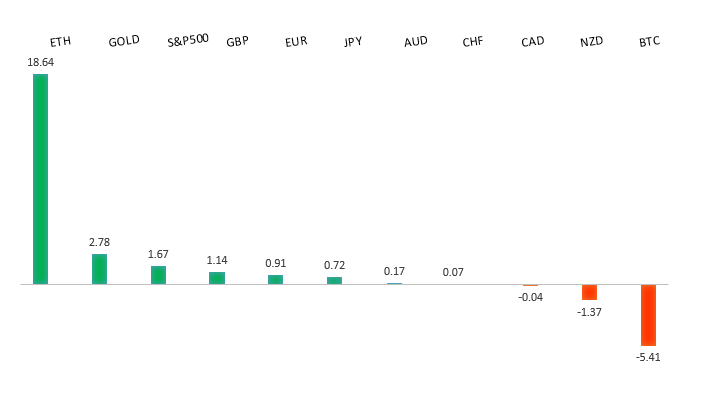
| Performance chart 30day v. USD (%) | ||
 | ||
| Technical & fundamental highlights | ||
| EURUSD: technical overview | ||
| The Euro has broken out from a multi-month consolidation off a critical longer-term low. This latest push through the 2023 high (1.1276) lends further support to the case for a meaningful bottom, setting the stage for a bullish structural shift and the next major upside extension targeting the 2021 high at 1.2350. Setbacks should be exceptionally well supported ahead of 1.1000. | ||
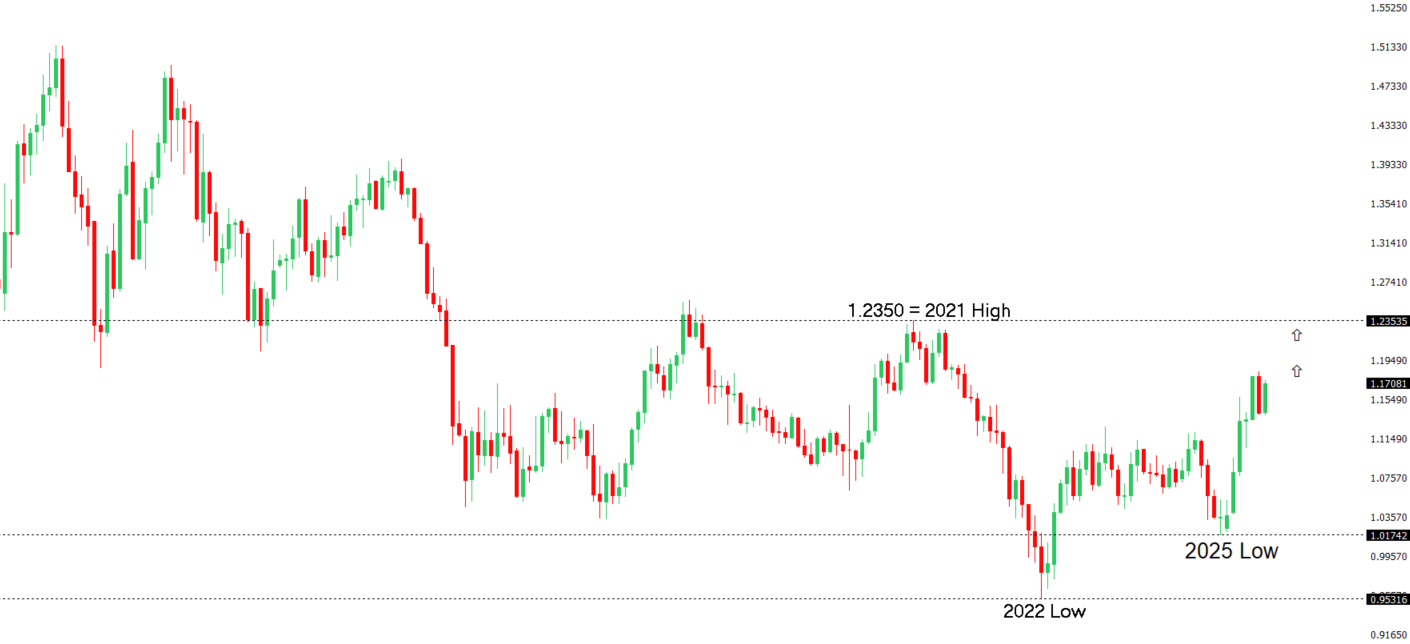 | ||
| R2 1.1789 - 24 July high - Medium R1 1.1743 - 22 August high - Medium S1 1.1583 - 22 August low - Medium S2 1.1392 - 1 August low - Strong | ||
| EURUSD: fundamental overview | ||
| Fed Chair Powell’s hint at a September rate cut and looming US tariffs on European goods (excluding autos, pharmaceuticals, and chips) highlight policy and trade divergences. In the Eurozone, consumer confidence dipped to a four-month low of -15.5, and economic sentiment fell to 95.2, driven by weaker services and construction sectors, while bank lending grew steadily. Political uncertainty in France, with Prime Minister Bayrou facing a likely defeat in a confidence vote, adds market tension, and ECB divisions on inflation risks signal caution despite stable rates and rising German and French bond yields. European stocks showed mixed results, with tech stocks volatile after Nvidia’s earnings and broader concerns about AI-driven market sustainability. | ||
| USDJPY: technical overview | ||
| There are signs of a meaningful top in place after the market put in a multi-year high in 2024. At this point, the door is now open for a deeper setback below the 2024 low at 139.58, exposing a retest of the 2023 low. Rallies should be well capped below 152.00. | ||
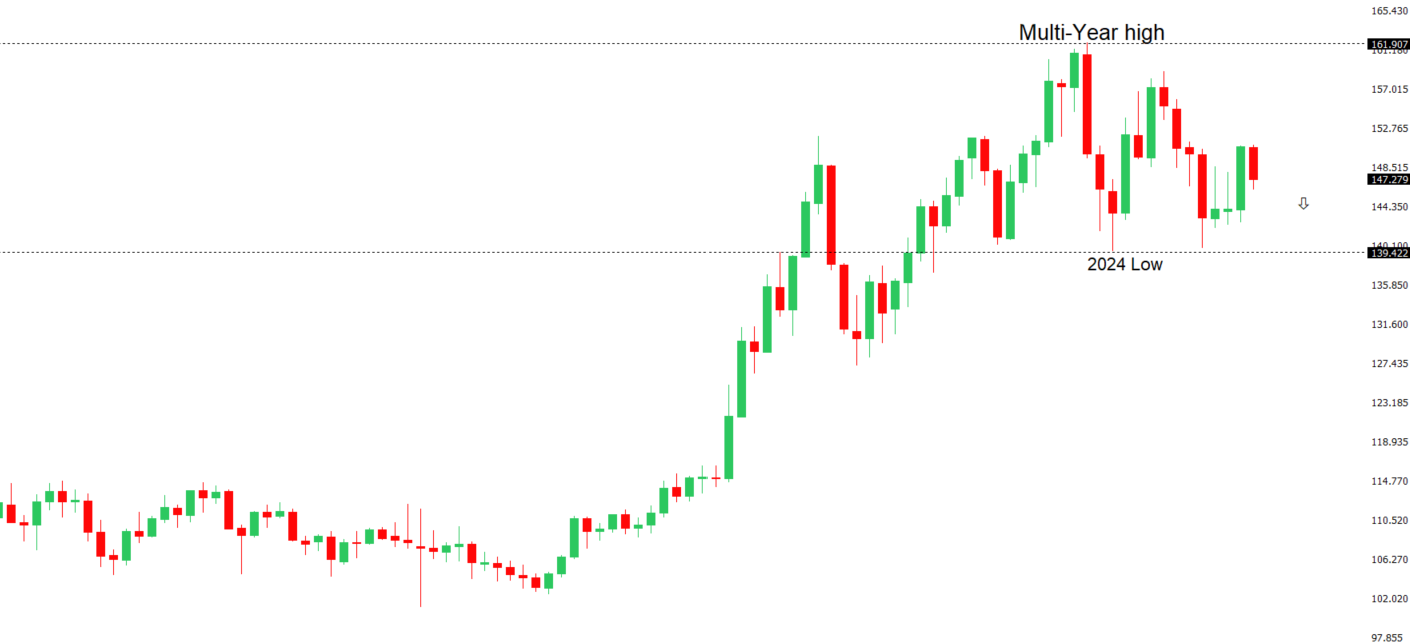 | ||
| R2 150.92 - 1 August high - Strong R1 148.52 - 12 August high - Medium S1 146.21 - 14 August low - Medium S2 145.85 - 24 July low - Strong | ||
| USDJPY: fundamental overview | ||
| Japan’s yen strengthened amid mixed economic data. Tokyo’s core consumer prices rose 2.5% in August 2025, above the Bank of Japan’s 2% target, signaling potential for further rate hikes despite a pause due to U.S. tariff concerns. The unemployment rate fell to 2.3% in July, the lowest since December 2019, while industrial production dropped sharply by 1.6% and retail sales growth slowed to 0.3%, the weakest since February 2022. Japan’s 10-year bond yield neared a 17-year high at 1.62%. | ||
| AUDUSD: technical overview | ||
| There are signs of the potential formation of a longer-term base with the market trading down into a meaningful longer-term support zone. Only a monthly close below 0.5500 would give reason for rethink. A monthly close back above 0.7000 will take the big picture pressure off the downside and strengthen case for a bottom. | ||
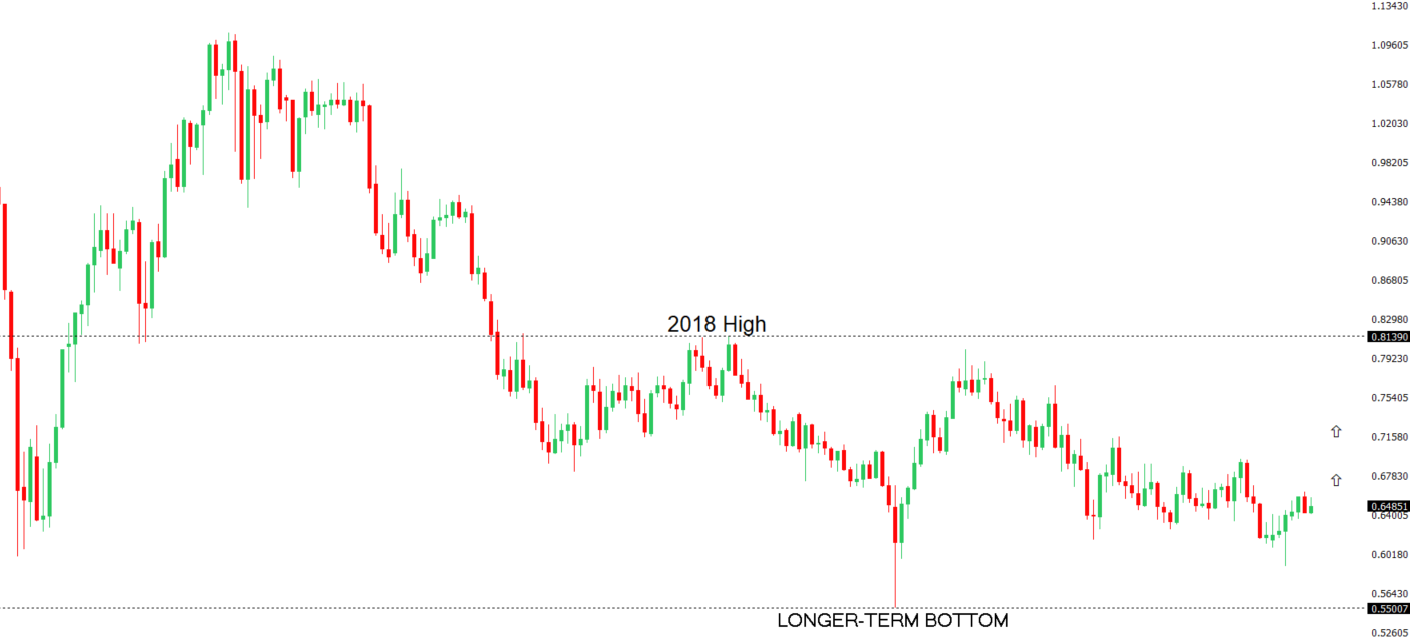 | ||
| R2 0.6600 - Figure - Medium R1 0.6569 - 14 August high - Medium S1 0.6414 - 22 August low - Medium S1 0.6373 - 23 June low - Strong | ||
| AUDUSD: fundamental overview | ||
| The Australian dollar rose for the third consecutive day as higher-than-expected July inflation data reduced expectations for an imminent RBA rate cut, with markets now anticipating only 34 basis points of easing in 2025 and a possible cut in November. A weaker US dollar, driven by increased bets on a September Fed rate cut and political uncertainty surrounding Fed Governor Lisa Cook, further supported the Aussie dollar. Domestically, strong business investment and a 0.2% rise in the S&P/ASX 200, led by financial and defensive sectors, bolstered market sentiment, though energy and healthcare stocks lagged due to weaker oil prices and disappointing earnings. | ||
| Suggested reading | ||
| Attempting To Make Banks Big By Decree, J. Tamny, Forbes (August 26, 2025) It’s 1995 for AI, S. McBride, Risk Hedge (August 25, 2025) | ||