


|
||
| 22nd April 2025 | view in browser | ||
| Trump Slams Fed, Buck hits 3-Year low | ||
|
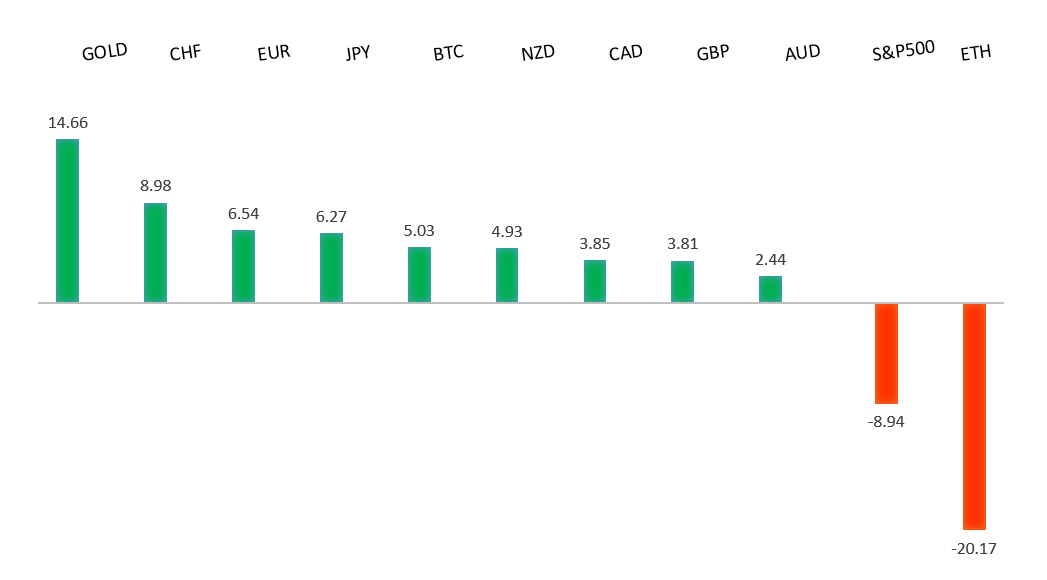
Risk assets have come under added pressure following President Trump’s Truth Social post demanding “preemptive” Federal Reserve rate cuts, accusing the Fed Chair of lagging and politicizing monetary policy. This has translated to three-year lows for the US Dollar against outperforming peers. |
||
| Performance chart 30day v. USD (%) | ||
|
||
| Technical & fundamental highlights | ||
| EURUSD: technical overview | ||
|
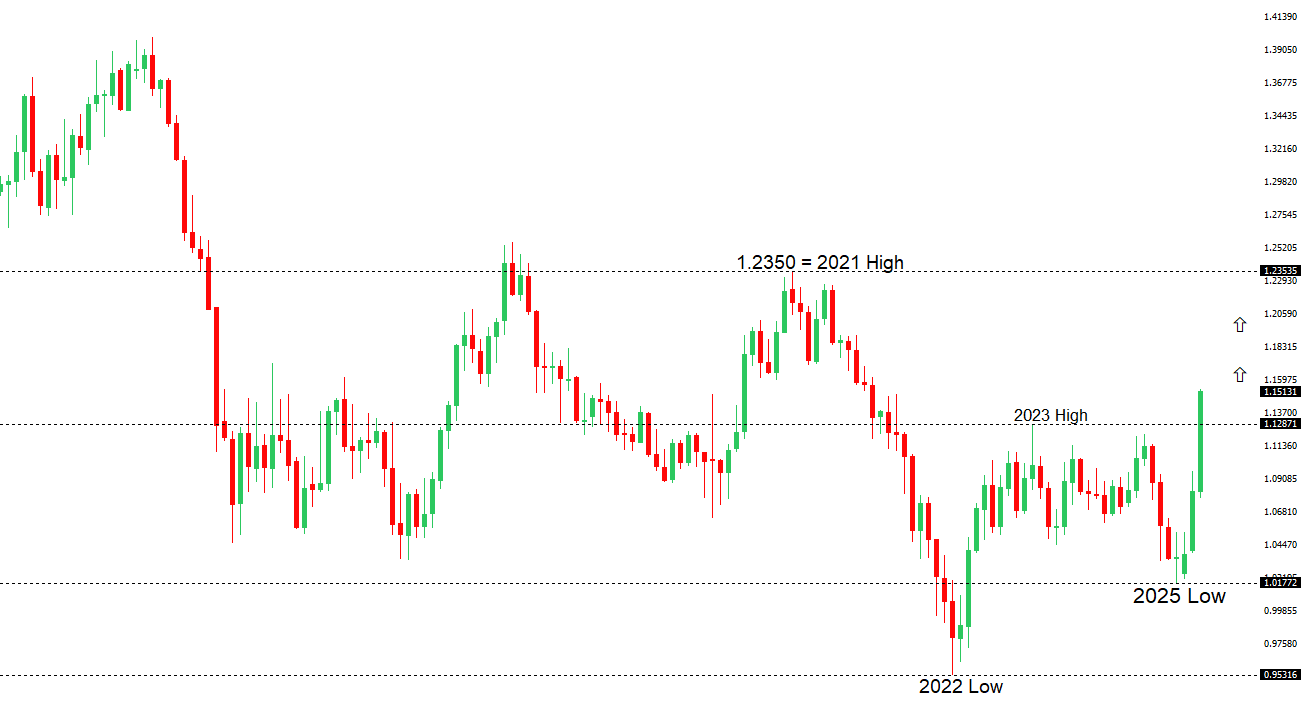
The Euro has finally broken out from a multi-month consolidation off a critical longer-term low. This latest push through the 2023 high lends further support to the case for a meaningful bottom, setting the stage for a bullish structural shift and the next major upside extension targeting the 2021 high at 1.2350. Setbacks should be exceptionally well supported below 1.1000. |
||
|
||
|
R2 1.1600
- Figure - Medium
R1 1.1574 - 21 April/2025 high - Strong S1 1.1335 - 17 April low - Medium S2 1.1264 - 15 April low - Strong |
||
| EURUSD: fundamental overview | ||
|
The Euro has been a prime beneficiary of the ongoing “Sell America, Buy Gold, and non-USD currencies” theme, driven by a weakening U.S. dollar, which is increasingly treated like an emerging market currency despite its yield advantage. The Euro’s strength, as the largest DXY component, is bolstered by Chinese investors and global asset managers diversifying into European bonds, particularly German bunds, amid U.S. trade policy volatility under President Trump. The ECB’s recent rate cut and dovish leanings have not dented the Euro’s bull case, with improving Eurozone growth prospects and resilient service PMIs in Germany more than offsetting. Geopolitical developments, including Russia’s openness to a Ukraine ceasefire and Trump’s NATO proposal, further reduce regional risk premiums, indirectly supporting the Euro’s upward trajectory. Looking ahead, key standouts on Tuesday’s calendar come from some ECB speak, Fed speak, Eurozone consumer confidence, the Richmond Fed manufacturing index and BOE speak. |
||
| GBPUSD: technical overview | ||
|
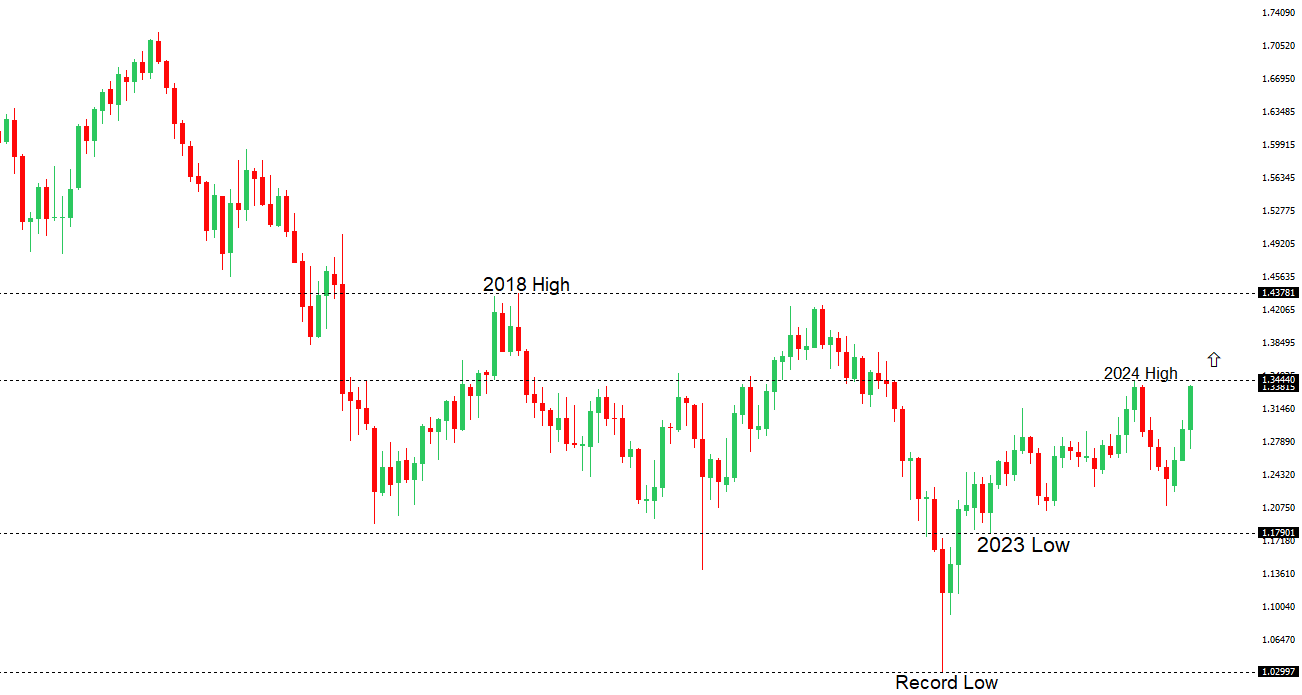
Signs have emerged of the market wanting to put in a longer-term base after collapsing to a record low in September 2022. The door is now open for the next major upside extension towards the 2018 high at 1.4377. Setbacks should be well supported above 1.2500 on a monthly close basis. |
||
|
||
|
R2 1.3435
- 26 September high - Strong
R1 1.3424 - 22 April/2025 high - Medium S1 1.3274 - 21 April low - Medium S2 1.3203 - 17 April low - Medium |
||
| GBPUSD: fundamental overview | ||
|
The Pound has run up to a fresh yearly high against the Buck, buoyed by optimism around a potential UK-U.S. trade deal. Vice President Vance has been on the wires saying there is a good chance a deal will get done. The UK’s strategic pivot to a narrow economic agreement, avoiding contentious issues like agriculture, has helped to mitigate tariff impacts and preserve GBP stability. Looking ahead, key standouts on Tuesday’s calendar come from some ECB speak, Fed speak, Eurozone consumer confidence, the Richmond Fed manufacturing index and BOE speak. |
||
| USDJPY: technical overview | ||
|
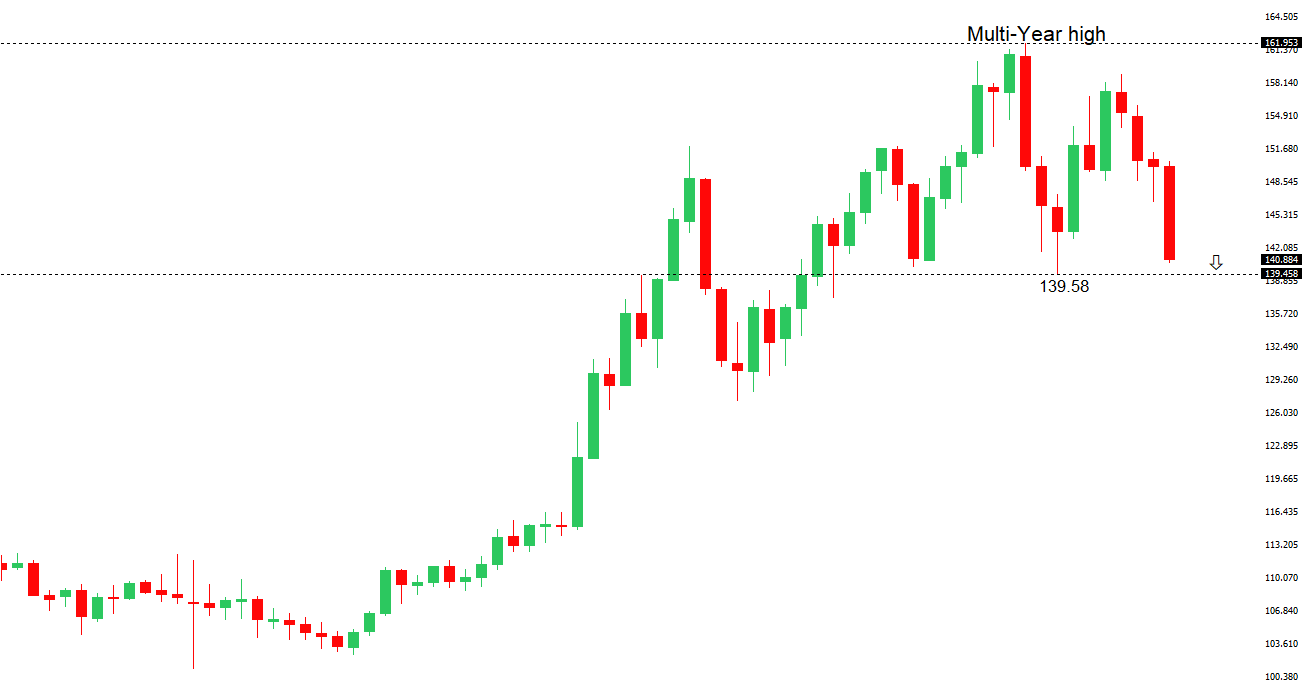
There are signs of a meaningful top in place after the market put in a multi-year high in 2024. At this point, the door is now open for a deeper setback below the 2024 low at 139.58 over the coming sessions. |
||
|
||
|
R2 143.60
- 15 April high - Medium
R1 142.11 - 21 April high - Medium S1 139.89 - 22 April/2025 low - Medium S2 139.58 - 2024 Low - Strong |
||
| USDJPY: fundamental overview | ||
|
CFTC data shows speculators’ net long JPY positions surging to 171,855 contracts, driven by heightened U.S.-Japan trade tensions and a weakening U.S. dollar amid fears of U.S. stagflation and declining asset credibility. Japan’s firm stance in trade talks, with PM Ishiba resisting U.S. demands for greater auto and agricultural market access while prioritizing national interests, has also fueled a risk-off sentiment supporting the Yen on traditional correlations. The Bank of Japan’s commitment to gradual rate hikes, despite potential downward revisions to growth and inflation forecasts, further underpins the Yen’s appeal. Looking ahead, key standouts on Tuesday’s calendar come from some ECB speak, Fed speak, Eurozone consumer confidence, the Richmond Fed manufacturing index and BOE speak. |
||
| AUDUSD: technical overview | ||
|
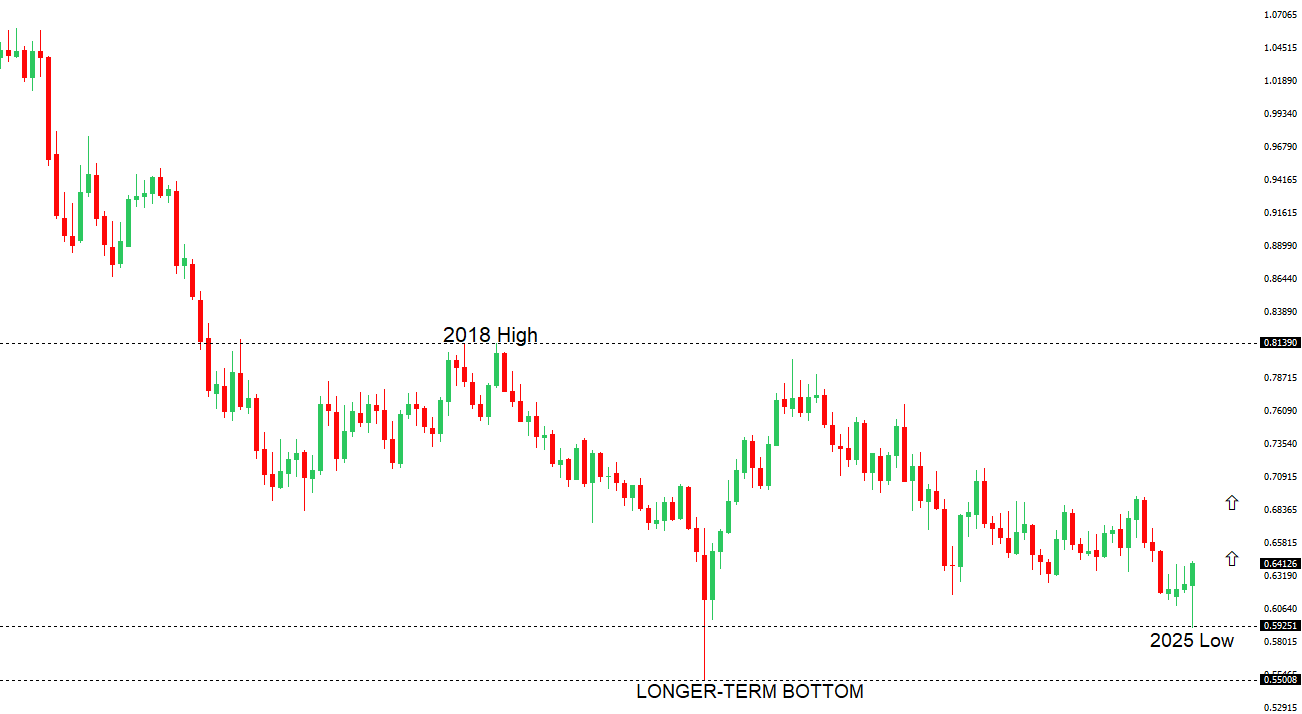
There are signs of the potential formation of a longer-term base with the market trading down into a meaningful longer-term support zone. Only a monthly close below 0.5500 would give reason for rethink. A monthly close back above 0.7000 will take the big picture pressure off the downside and strengthen case for a bottom. |
||
|
||
|
R2 0.6500
- Psychological - Strong
R1 0.6440 - 22 April/2025 high - Medium S1 0.6333 - 17 April low - Medium S1 0.6275 - 14 April low - Strong |
||
| AUDUSD: fundamental overview | ||
|
The Australian Dollar has been resilient, despite tariff uncertainties, on account of offsetting expectations for Chinese policy stimulus to counter U.S. tariffs. The RBA’s cautious stance on rate cuts, with markets pricing in a May cut following robust labor data has also tempered expectations for an aggressive easing response. Upcoming April PMI surveys will be closely watched for any indication of tariff impacts on Australia’s economy. Looking ahead, key standouts on Tuesday’s calendar come from some ECB speak, Fed speak, Eurozone consumer confidence, the Richmond Fed manufacturing index and BOE speak. |
||
| Suggested reading | ||
|
Paul Volcker Never Was Because Monetarism Never Will Be, J. Tamny, Forbes (April 20, 2025) How will Wall Street react to the Trump-Powell showdown?, J. Mathis, The Week (April 20, 2025) |
||