


|
||
| 23rd April 2025 | view in browser | ||
| Trade optimism lifts stocks, Buck still struggling | ||
|
The U.S. market rebound, sparked by reported progress in trade talks with India and a softened U.S. stance toward China, including Trump’s dismissal of tariff hikes and threats to oust Federal Reserve Chair Powell, signals a welcome shift to a de-escalation phase in Trump’s trade strategy, with Treasury Secretary Bessent promoting pro-market policies. |
||
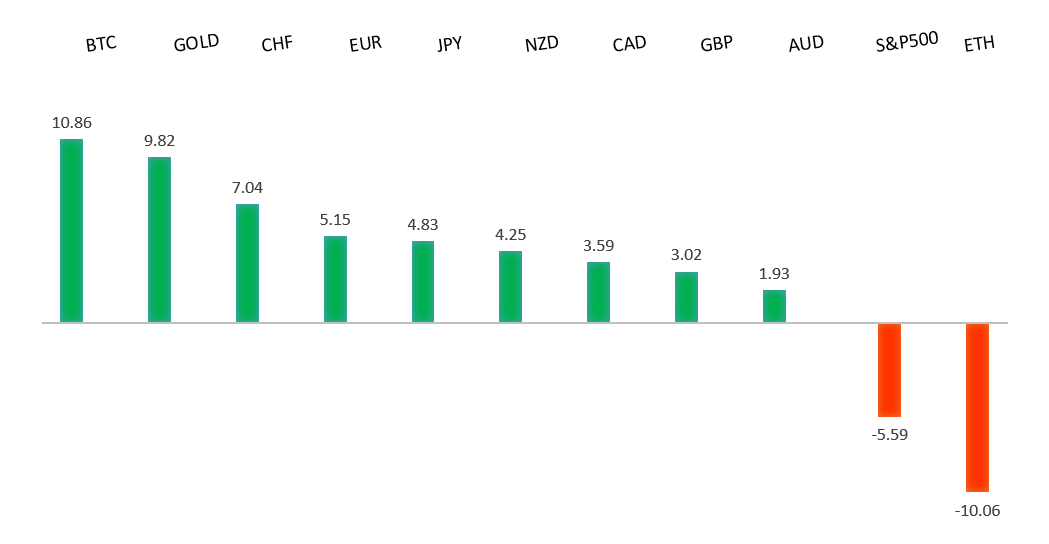
| Performance chart 30day v. USD (%) | ||
|
||
| Technical & fundamental highlights | ||
| EURUSD: technical overview | ||
|
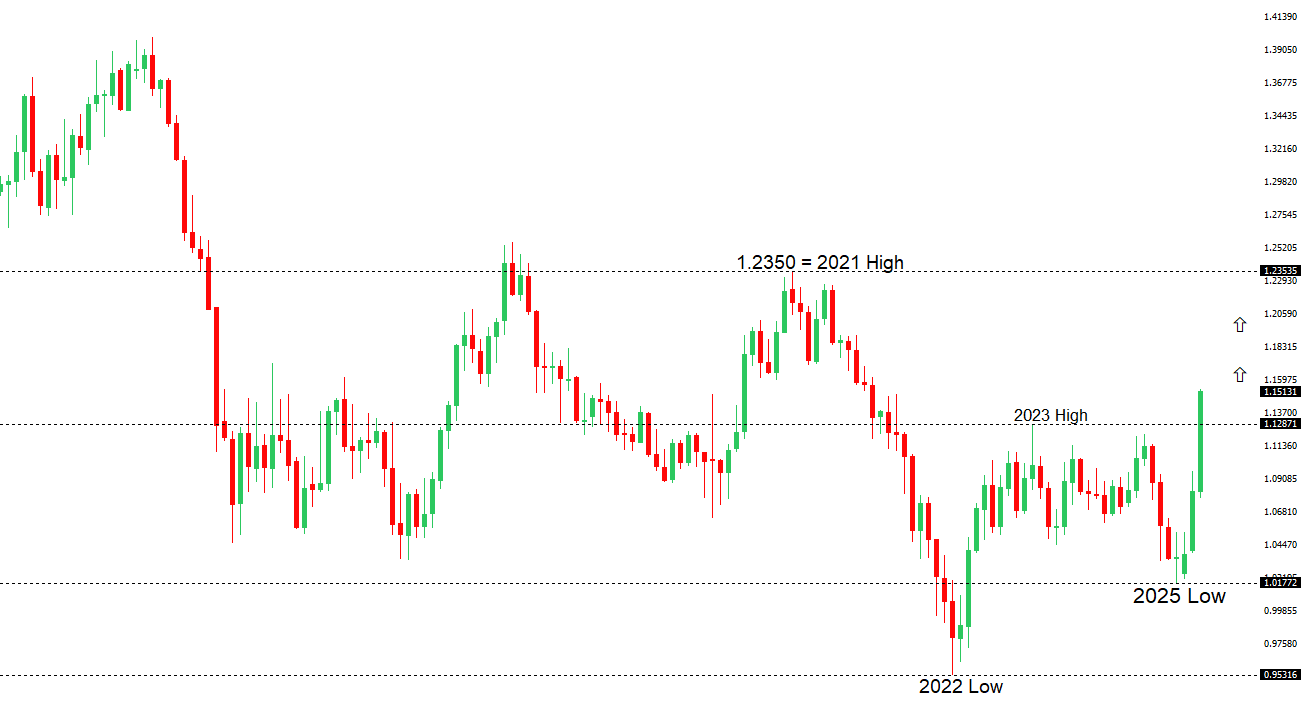
The Euro has finally broken out from a multi-month consolidation off a critical longer-term low. This latest push through the 2023 high lends further support to the case for a meaningful bottom, setting the stage for a bullish structural shift and the next major upside extension targeting the 2021 high at 1.2350. Setbacks should be exceptionally well supported below 1.1000. |
||
|
||
|
R2 1.1600
- Figure - Medium
R1 1.1574 - 21 April/2025 high - Strong S1 1.1308 - 23 April low - Medium S2 1.1264 - 15 April low - Strong |
||
| EURUSD: fundamental overview | ||
|
The Euro continues to benefit from a persistent trend of selling U.S. assets in favor of non-U.S. currencies. The ECB’s latest survey slightly raised inflation forecasts to 2.2% for 2025 and 2% for 2026, with long-term expectations steady at the 2% target, while economic growth projections were lowered to 0.9% and 1.2% for 2025 and 2026, respectively, and unemployment forecasts improved to 6.3%. ECB President Lagarde emphasized a data-dependent approach to potential pauses in the rate-cutting cycle, while ECB de Guindos suggested the Euro could challenge the dollar as a reserve currency if Europe deepens integration, though this is a long-term goal. April Preliminary PMI data for the Eurozone, including Germany and France, is due today, with manufacturing PMIs expected to remain contractionary and France’s services sector likely to lag. |
||
| USDJPY: technical overview | ||
|
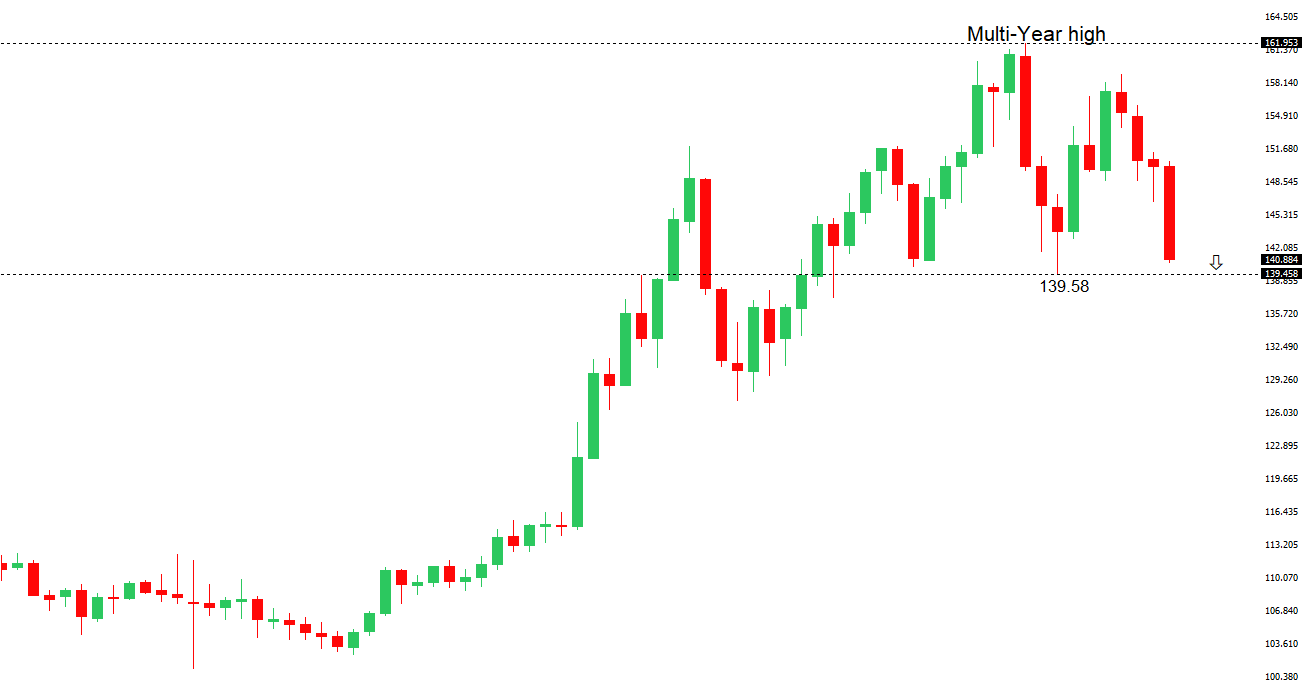
There are signs of a meaningful top in place after the market put in a multi-year high in 2024. At this point, the door is now open for a deeper setback below the 2024 low at 139.58 over the coming sessions. |
||
|
||
|
R2 143.60
- 15 April high - Medium
R1 143.22 - 23 April high - Medium S1 139.89 - 22 April/2025 low - Medium S2 139.58 - 2024 Low - Strong |
||
| USDJPY: fundamental overview | ||
|
U.S.-Japan trade talks are critical, with markets watching for Trump’s concessions on tariffs, which could support the dollar and risk assets while prompting profit-taking on yen longs. Japan, led by Prime Minister Ishiba, is pushing back to protect its interests and engaging China to avoid trade friction. Quick wins like tariff-free U.S. rice imports are likely, but Japan’s Finance Minister Kato may avoid firm currency commitments, favoring “market-determined rates.” The BOJ remains cautious on rate hikes, potentially cutting 2027 inflation forecasts to 2% and this year’s growth projection from 1.1% to 0.5% due to a stronger yen and tariff uncertainties. |
||
| AUDUSD: technical overview | ||
|
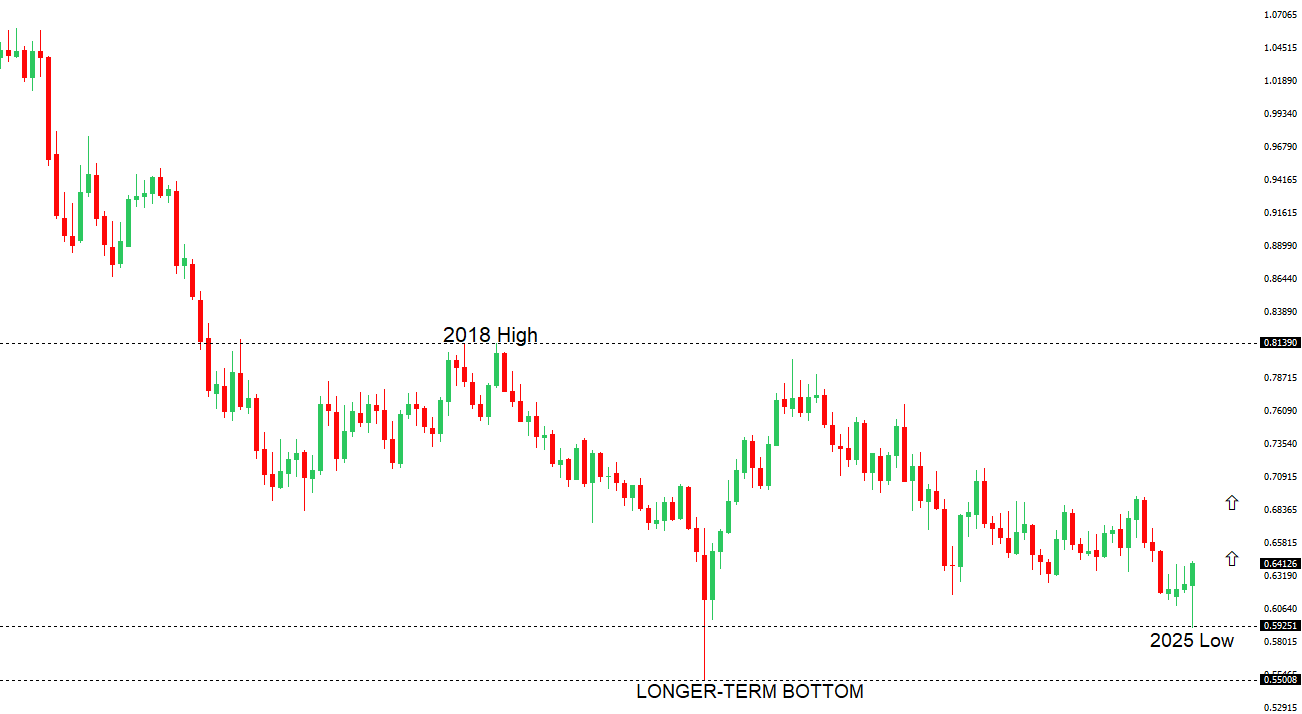
There are signs of the potential formation of a longer-term base with the market trading down into a meaningful longer-term support zone. Only a monthly close below 0.5500 would give reason for rethink. A monthly close back above 0.7000 will take the big picture pressure off the downside and strengthen case for a bottom. |
||
|
||
|
R2 0.6500
- Psychological - Strong
R1 0.6440 - 22 April/2025 high - Medium S1 0.6333 - 17 April low - Medium S1 0.6275 - 14 April low - Strong |
||
| AUDUSD: fundamental overview | ||
|
The Australian Dollar appears to be forming a bottom as investors rotate out of USD assets, with potential for further gains if China bolsters economic support to counter U.S. tariffs. And although U.S.-China trade dynamics remain volatile, the Trump administration’s signaling of a softer stance has helped the Australian Dollar. OIS markets are pricing in a certain RBA rate cut in May, as economic growth concerns outweigh inflation risks. |
||
| Suggested reading | ||
|
Peak America?, J. Calhoun, Alhambra (April 20, 2025) The ultimate self-driving car stock, S. McBride, RiskHedge (April 18, 2025) |
||