


 | ||
| 17th April 2026 | view in browser | ||
| Ceasefire optimism offsetting escalation fears | ||
| Global markets are navigating fragile optimism heading into Friday, supported by President Trump’s bullish tone on an imminent end to the Iran conflict and ceasefire progress, yet tempered by unverified escalation risks, diverging central bank signals, and cautious risk trimming into the weekend. | ||
| Performance chart 30day v. USD (%) | ||
 | ||
| Technical & fundamental highlights | ||
| EURUSD: technical overview | ||
| The Euro outlook remains constructive with higher lows sought out on dips in favor of the next major upside extension targeting the 2021 high at 1.2350. Setbacks should be exceptionally well supported ahead of 1.1300. | ||
 | ||
| R2 1.1835 - 23 February high - Medium R1 1.1824 - 16 April high - Medium S1 1.1754 - 14 April low - Medium S2 1.1650 - 9 April low - Strong | ||
| EURUSD: fundamental overview | ||
| The euro has been supported against the US dollar by easing geopolitical tensions in the Middle East, as optimism around resumed US-Iran ceasefire negotiations in the coming days and a fragile truce have reduced safe-haven demand for the greenback, even amid the ongoing US blockade of Iranian ports in the Strait of Hormuz and related Chinese criticism. This risk-on sentiment has helped lift the euro toward levels not seen since February. On the data side, softer-than-expected US Producer Price Index figures—showing annual headline inflation – have reinforced a bearish bias for the dollar by tempering expectations for aggressive Federal Reserve tightening. In the eurozone, the European Central Bank is maintaining a data-dependent stance ahead of its April meeting, with policymakers leaning toward holding rates unchanged while markets price in roughly two quarter-point hikes later this year; President Christine Lagarde has emphasized agility without any bias toward immediate tightening, even as elevated energy costs from regional instability continue to cloud the euro area’s growth and inflation outlook. Strong US private-sector job creation via the ADP report has offered some counter-support to the dollar, but overall fundamentals have favored modest euro resilience. | ||
| USDJPY: technical overview | ||
| There are signs of the formation of a meaningful top after the market put in a multi-year high in 2024. At this point, rallies should be well capped above 160.00 in favor of a fresh down-leg back towards the 2024 low at 139.58. Only a monthly close above 160.00 negates. | ||
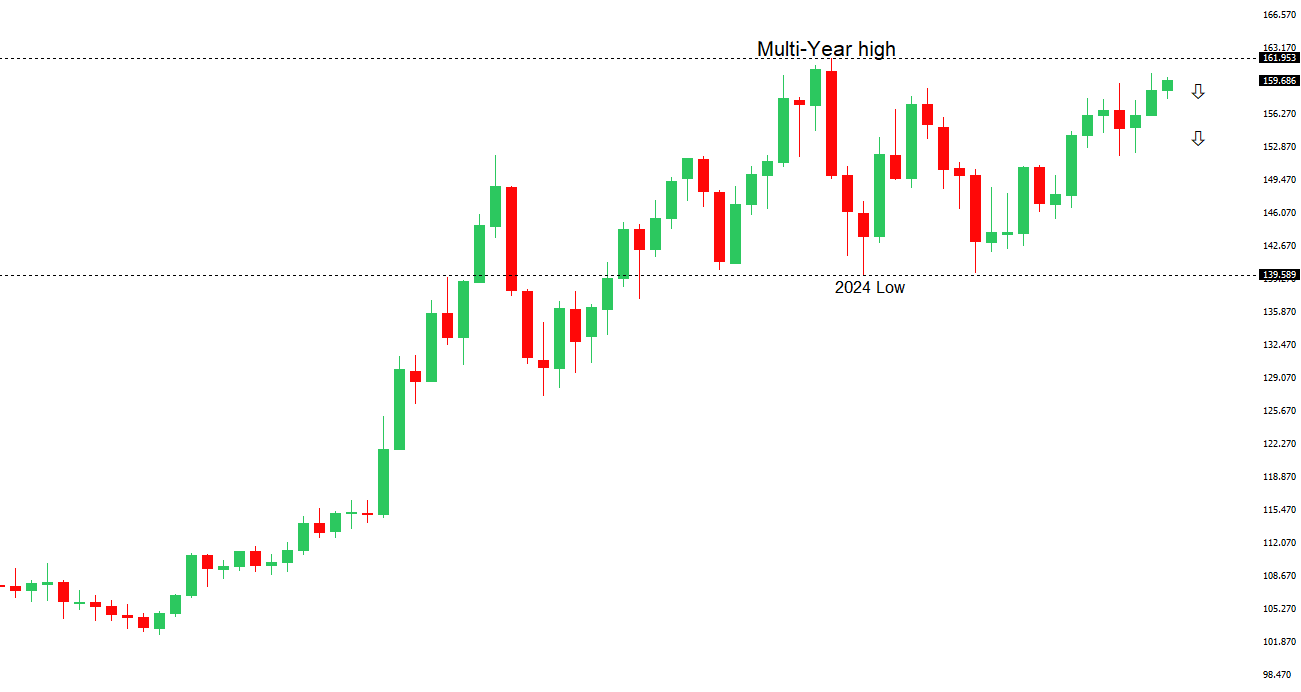 | ||
| R2 160.46 - 30 March/2026 high - Strong R1 160.03 - 7 April high - Medium S1 157.89 - 8 April low - Medium S2 157.51 - 19 March low - Strong | ||
| USDJPY: fundamental overview | ||
| The Japanese yen has faced downward pressure against the US dollar, with USDJPY trading near 159.50, as declining expectations for a Bank of Japan rate hike at the April 28 policy meeting have undermined the currency amid ongoing uncertainty from Middle East tensions. BoJ officials, including Governor Ueda, have signaled a cautious, data-dependent approach, cooling bets on near-term tightening despite earlier hawkish hints, while Japan’s heavy reliance on imported oil leaves the economy vulnerable to any escalation around the Strait of Hormuz. Finance Minister Katayama’s comments on discussions with US Treasury Secretary Scott Bessent regarding foreign exchange have revived fears of potential intervention, providing some support to the yen and capping the pair’s upside from recent lows. At the same time, optimism over a fragile US-Iran ceasefire, the Israel-Lebanon truce, and receding hawkish Fed expectations have weighed on safe-haven dollar demand, though lingering geopolitical risks and concerns over Japan’s energy costs have prevented sharper yen appreciation. | ||
| AUDUSD: technical overview | ||
| There are signs of the formation of a longer-term base with the market recovering out from a meaningful longer-term support zone. The latest monthly close back above 0.7000 takes the big picture pressure off the downside and strengthens the case for a bottom, with the focus now on a push towards 0.8000. Setbacks should now be well supported ahead of 0.6700. | ||
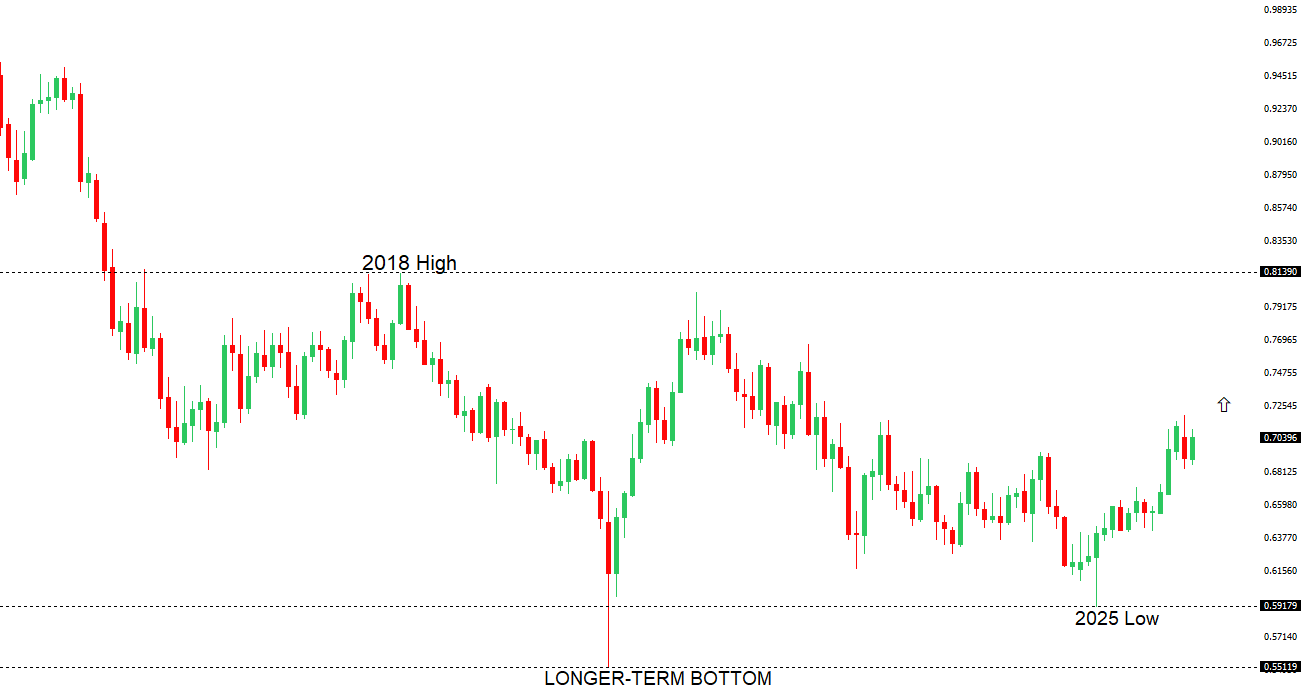 | ||
| R2 0.7284 - 3 June high/2022 - Strong R1 0.7198 - 16 April/2026 high - Medium S1 0.7077 - 14 April low - Medium S2 0.6963 - 8 April low - Strong | ||
| AUDUSD: fundamental overview | ||
| The Australian dollar has strengthened against the US dollar, recently pushing AUDUSD above 0.7100 and toward year-to-date highs near 0.7200, supported by improving risk sentiment from optimism around US-Iran ceasefire negotiations and the Israel-Lebanon truce, which have reduced safe-haven demand for the greenback amid a fragile Middle East truce. Domestically, the Reserve Bank of Australia maintains a hawkish tilt despite a narrow 5-4 vote on its latest 25 basis point hike to 4.10%, with officials emphasizing sticky inflation—headline CPI at 3.7% year-on-year, trimmed mean at 3.3%—and capacity constraints that could keep rates higher for longer, even as markets price in further tightening later this year while remaining data-dependent on global developments. Resilient Australian fundamentals, including a widening trade surplus, firm GDP growth, and a still-solid labor market with unemployment steady near 4.3%, have reinforced the currency’s appeal as a commodity-linked play. China’s economy, acting as a stabilizer rather than a strong growth engine with Q4 expansion at 4.5-5.0% and mixed retail sales, continues to provide moderate support for Australian exports, though softening external demand and producer price deflation temper the upside. Lingering geopolitical risks around the Strait of Hormuz and elevated energy prices add caution by sustaining some imported inflation pressures for the Aussie economy. | ||
| Suggested reading | ||
| The True Cost Of Oil And Gas, J. Klement Klement on Investing (April 13, 2026) What History Teaches Us About Market Volatility, L. Swedroe, Larry’s Substack (April 15, 2026) | ||