


 | ||
| 22nd May 2025 | view in browser | ||
| US bond auction flops as fiscal fears grow | ||
| The U.S. government’s $16 billion 20-year bond auction, the first major sale since Moody’s downgraded the U.S. credit rating, yielded a 1.2 basis point tail despite offering over 5%, signaling investor unease with fiscal irresponsibility, leading to sell-offs in the dollar, U.S. equities, and Treasuries. | ||
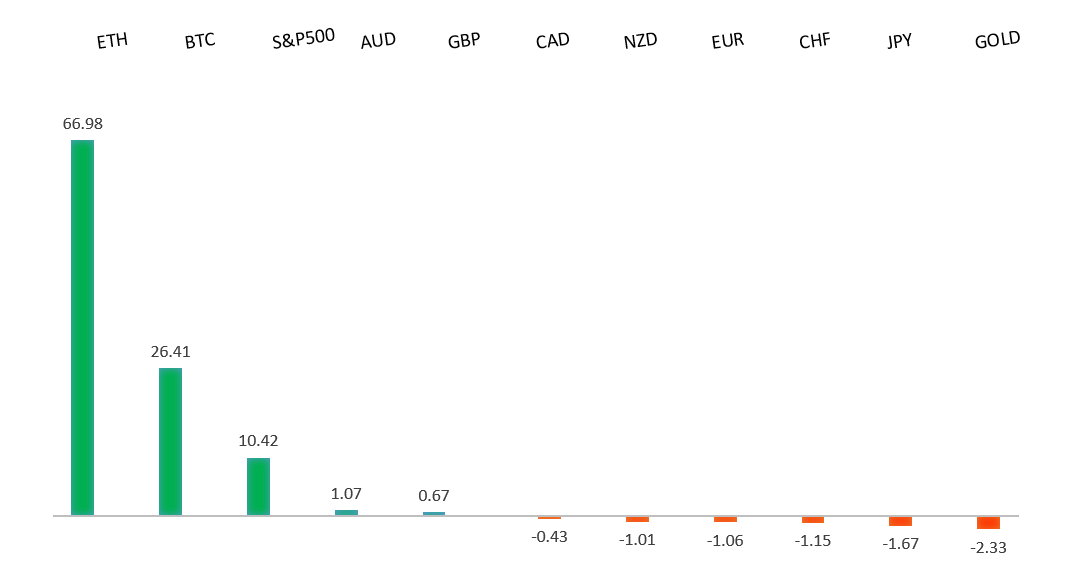
| Performance chart 30day v. USD (%) | ||
 | ||
| Technical & fundamental highlights | ||
| EURUSD: technical overview | ||
| The Euro has finally broken out from a multi-month consolidation off a critical longer-term low. This latest push through the 2023 high lends further support to the case for a meaningful bottom, setting the stage for a bullish structural shift and the next major upside extension targeting the 2021 high at 1.2350. Setbacks should be exceptionally well supported below 1.1000. | ||
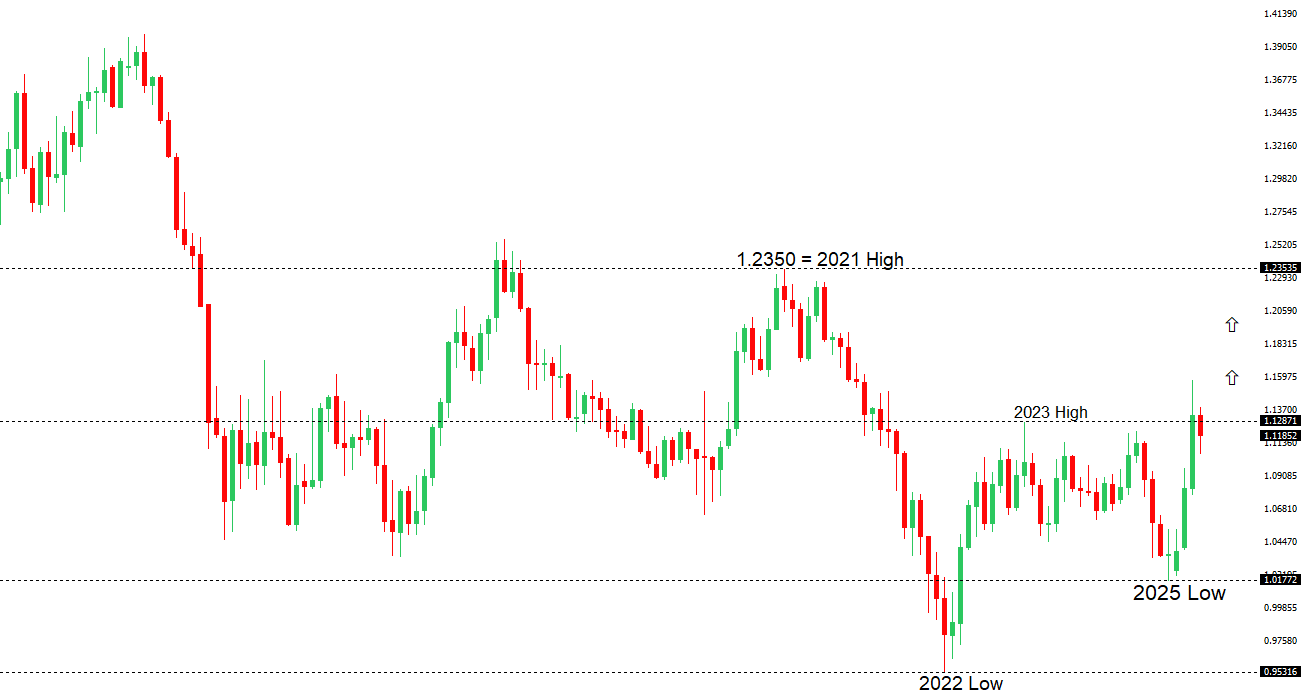 | ||
| R2 1.1474 - 11 April high - Medium R1 1.1382 - 6 May high - Medium S1 1.1131 - 16 May low - Medium S2 1.1065 - 12 May low - Medium | ||
| EURUSD: fundamental overview | ||
| The European Central Bank has warned that investor concerns over the riskiness of US assets, driven by Trump’s tariff policies, could destabilize global financial markets. The ECB’s Financial Stability Review noted unusual shifts away from safe-haven assets like the US dollar and Treasuries, signaling a potential “fundamental regime change” in global capital flows, with stretched US tech stock valuations adding to market vulnerabilities. Despite some easing of US-China trade tensions, uncertainties persist, prompting the ECB to lower interest rates to support growth as inflation nears its 2% target. Meanwhile, upcoming Eurozone PMI data for May is expected to show fragile recovery, with Germany’s Manufacturing PMI slightly improving to 48.8 and Services PMI rebounding to 49.5, while Eurozone Manufacturing and Services PMIs are forecast at 49.2 and 50.5, respectively, indicating modest expansion amid ongoing trade tensions and a stronger euro. | ||
| USDJPY: technical overview | ||
| There are signs of a meaningful top in place after the market put in a multi-year high in 2024. At this point, the door is now open for a deeper setback below the 2024 low at 139.58 over the coming sessions exposing a retest of the 2023 low. Rallies should be well capped below 150.00. | ||
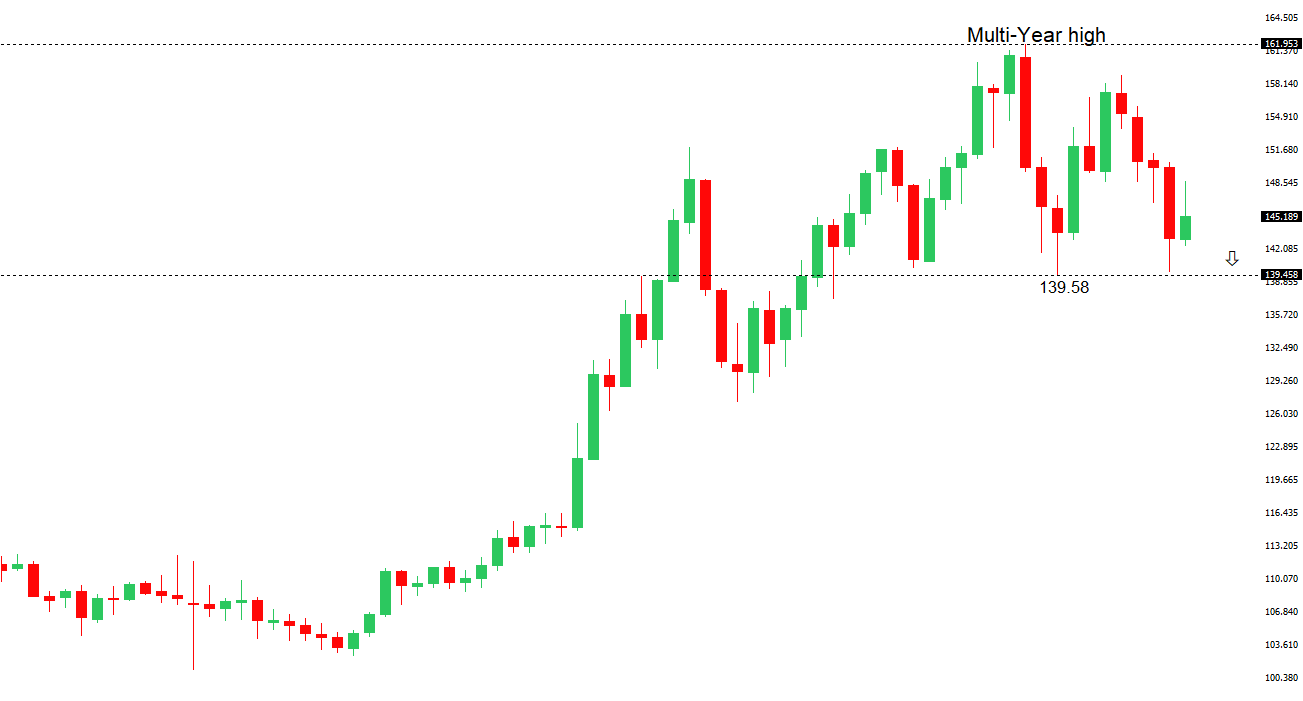 | ||
| R2 148.65 - 12 May high - Medium R1 146.19 - 9 May high - Medium S1 143.14 - 22 May low - Medium S2 142.35 - 6 May low - Medium | ||
| USDJPY: fundamental overview | ||
| Yields on long-dated Japanese Government Bonds (JGBs) have surged to a 20-year high of 2.845% for the 30-year bond, raising speculation about when Japanese investors, holding over $1 trillion in U.S. Treasuries, might repatriate capital due to attractive domestic yields and U.S. policy uncertainties under Trump’s tariffs. Japan could stabilize its yield curve by letting U.S. Treasury holdings mature without reinvesting, potentially strengthening the yen without aggressive monetary actions. Despite U.S.-Japan talks affirming market-driven exchange rates, trade negotiations and a weakening South Korean won may support yen appreciation, as traders anticipate currency adjustments to address U.S. concerns over Asian export advantages. The Bank of Japan, as noted by board member Asahi Noguchi, favors gradual rate hikes, cautious of risks from Trump’s “Liberation Day” tariffs due July 9, 2025, while former BOJ member Sayuri Shirai warns that high inflation expected this Friday could force faster policy normalization. May’s PMI data—Composite at 49.8, Manufacturing at 49.0, and Services at 50.8—signals economic weakness, but a successful trade deal could pave the way for a BOJ rate hike in July, boosting yen bullishness. | ||
| AUDUSD: technical overview | ||
| There are signs of the potential formation of a longer-term base with the market trading down into a meaningful longer-term support zone. Only a monthly close below 0.5500 would give reason for rethink. A monthly close back above 0.7000 will take the big picture pressure off the downside and strengthen case for a bottom. | ||
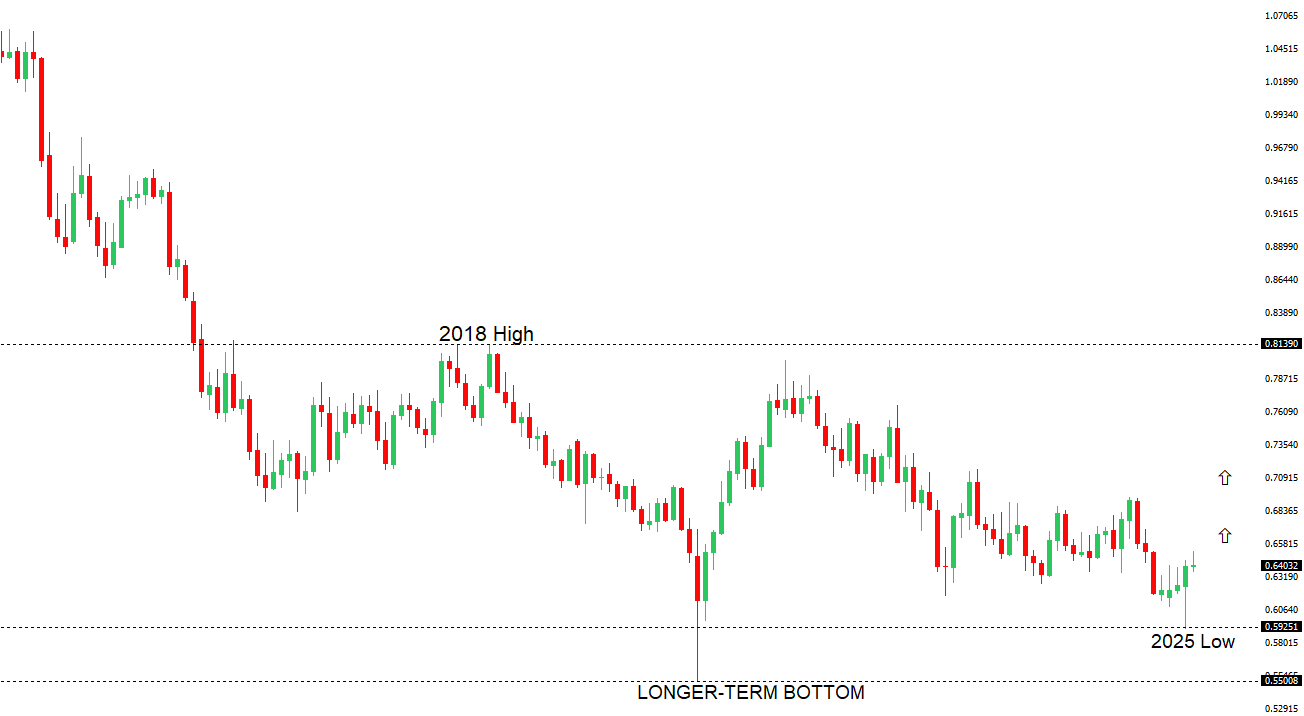 | ||
| R2 0.6550 - 25 November high - Strong R1 0.6515 - 7 May/2025 high - Medium S1 0.6344 - 24 April low - Medium S1 0.6275 - 14 April low - Strong | ||
| AUDUSD: fundamental overview | ||
| The Reserve Bank of Australia has shifted its stance from cautious rate cuts to signaling readiness for faster reductions if economic conditions weaken, prompting markets to anticipate a cut as early as July, potentially lowering rates to 3.1% by year-end with three cuts, though some expect only one or two unless the economy deteriorates significantly. Recent data shows a mixed picture: April’s Westpac Leading Index slightly improved to -0.01%, while May’s PMI Composite dipped to 50.6, with Manufacturing steady at 51.7 and Services at 50.5, indicating modest growth. Bloomberg’s survey of 45 economists projects Australia’s economy to grow 1.8% in 2025, 2.3% in 2026, and 2.5% in 2027, with an 18% recession risk over the next year, stable Q1 2025 GDP at 0.5%, and CPI forecasts at 2.5% for 2025 and 2.7% for 2026, with the RBA rate expected at 3.60% by Q3 2025 from the current 3.85%. | ||
| Suggested reading | ||
| Why we should welcome stock-market bubbles, M. Hulbert, MarketWatch (May 20, 2025) The Tax Bill Could Add to the Deficit—and to Stock Gains, T. Rivas, Barron’s (May 20, 2025) | ||