


 | ||
| 23rd May 2025 | view in browser | ||
| Trump tax bill sparks treasury turbulence | ||
| President Trump’s tax legislation initially triggered a Treasuries sell-off, but markets calmed as attention shifted to U.S. economic indicators, though Senate revisions—broadening tax breaks and reinstating program funding—could increase deficits, potentially provoking a bond market reaction. | ||
| Performance chart 30day v. USD (%) | ||
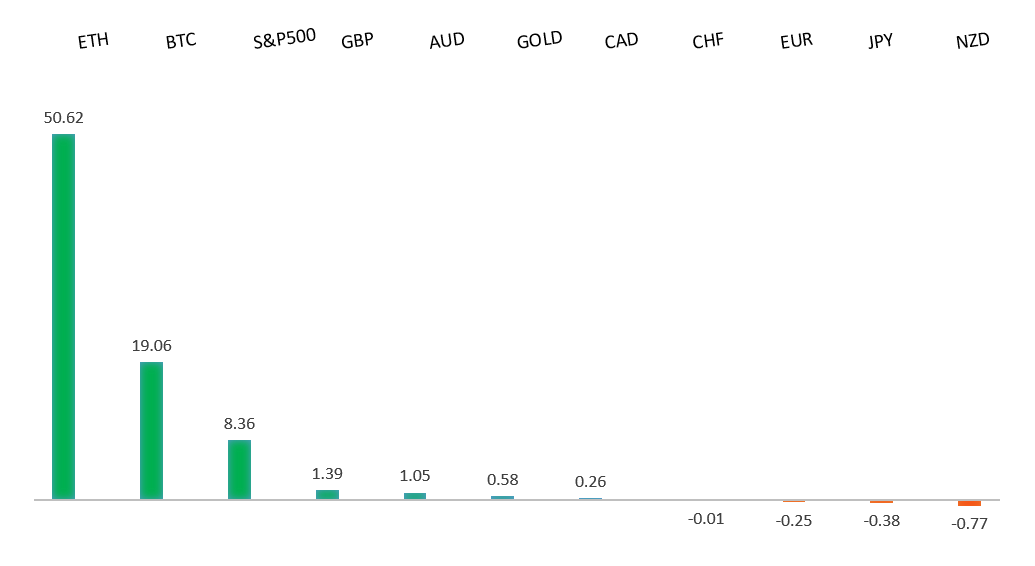 | ||
| Technical & fundamental highlights | ||
| EURUSD: technical overview | ||
| The Euro has finally broken out from a multi-month consolidation off a critical longer-term low. This latest push through the 2023 high lends further support to the case for a meaningful bottom, setting the stage for a bullish structural shift and the next major upside extension targeting the 2021 high at 1.2350. Setbacks should be exceptionally well supported below 1.1000. | ||
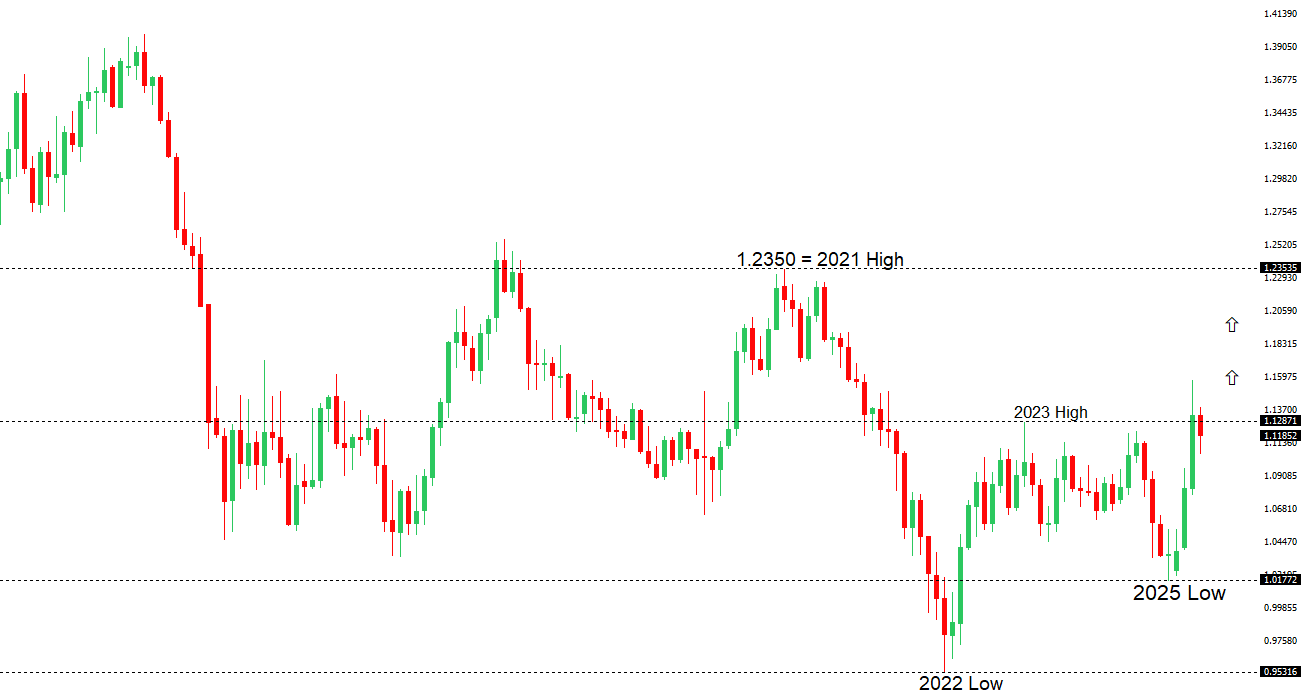 | ||
| R2 1.1474 - 11 April high - Medium R1 1.1382 - 6 May high - Medium S1 1.1131 - 16 May low - Medium S2 1.1065 - 12 May low - Medium | ||
| EURUSD: fundamental overview | ||
| After three consecutive days of gains, traders took profits following weaker-than-expected Eurozone and German PMI data, though markets stabilized in today’s Asian session. The Eurozone Composite PMI slipped to 49.5 in May, signaling the first contraction in private sector activity this year, driven by a sharp decline in services (48.9), despite a slight improvement in manufacturing (49.4). Germany, the Eurozone’s largest economy, mirrored this trend with its Composite PMI at 48.6, as services weakened further, though manufacturing showed signs of stabilizing at a 33-month high. ECB minutes from April reveal a strong inclination toward further monetary easing, with expected rate cuts of 26 basis points in June and possibly September, aiming for a terminal rate of 1.75%, though decisions remain data-dependent amid concerns over U.S. tariffs and their uncertain impact on inflation. Analysts forecast sluggish Eurozone growth of 0.8% in 2025, with PMI expected to hover around 49.1 by mid-2025, improving to 51.0 by 2026, while Germany’s IFO Business Climate Index rose to 87.5, buoyed by optimism in export industries despite tariff tensions. Upcoming German data, including Q1 GDP and spending figures, will provide further insight into the region’s economic trajectory. | ||
| USDJPY: technical overview | ||
| There are signs of a meaningful top in place after the market put in a multi-year high in 2024. At this point, the door is now open for a deeper setback below the 2024 low at 139.58 over the coming sessions exposing a retest of the 2023 low. Rallies should be well capped below 150.00. | ||
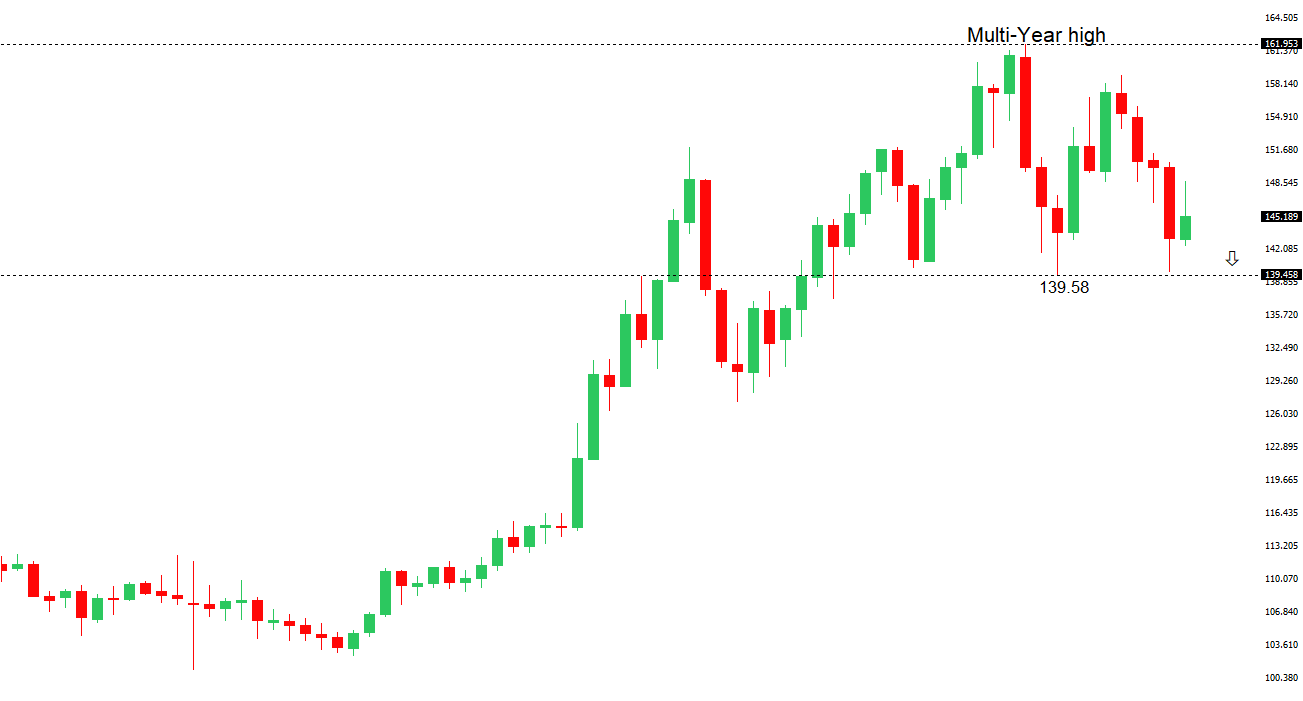 | ||
| R2 148.65 - 12 May high - Medium R1 146.19 - 9 May high - Medium S1 142.80 - 22 May low - Medium S2 142.35 - 6 May low - Medium | ||
| USDJPY: fundamental overview | ||
| Japanese government bond yields have surged to record highs, with 20-year JGBs reaching 2.599% and 30-year JGBs hitting 3.204%, raising concerns about a potential yen carry trade unwind as Japanese investors may repatriate capital from global markets, particularly U.S. Treasuries and equities, if yields become attractive enough. The Bank of Japan could stabilize its yield curve by allowing U.S. Treasury holdings to mature without reinvesting, potentially strengthening the yen, though aggressive sales are unlikely amid U.S. trade talks. Despite official statements from U.S. and Japanese officials that exchange rates should be market-driven, speculation persists about a tacit agreement for yen appreciation to address trade imbalances, fueled by Trump’s criticism of Asian currency manipulation. BOJ’s Asahi Noguchi advocates a cautious, data-driven approach to rate hikes, citing increased risks from U.S. “Liberation Day” tariffs, while April’s hotter-than-expected inflation (core CPI at 3.5% YoY) strengthens the case for tighter policy. However, former BOJ member Sayuri Shirai warns that fragile domestic demand and a potential recession may limit the BOJ’s rate hike window, with a successful U.S. trade deal by July 9 potentially paving the way for a BOJ rate hike in July. | ||
| AUDUSD: technical overview | ||
| There are signs of the potential formation of a longer-term base with the market trading down into a meaningful longer-term support zone. Only a monthly close below 0.5500 would give reason for rethink. A monthly close back above 0.7000 will take the big picture pressure off the downside and strengthen case for a bottom. | ||
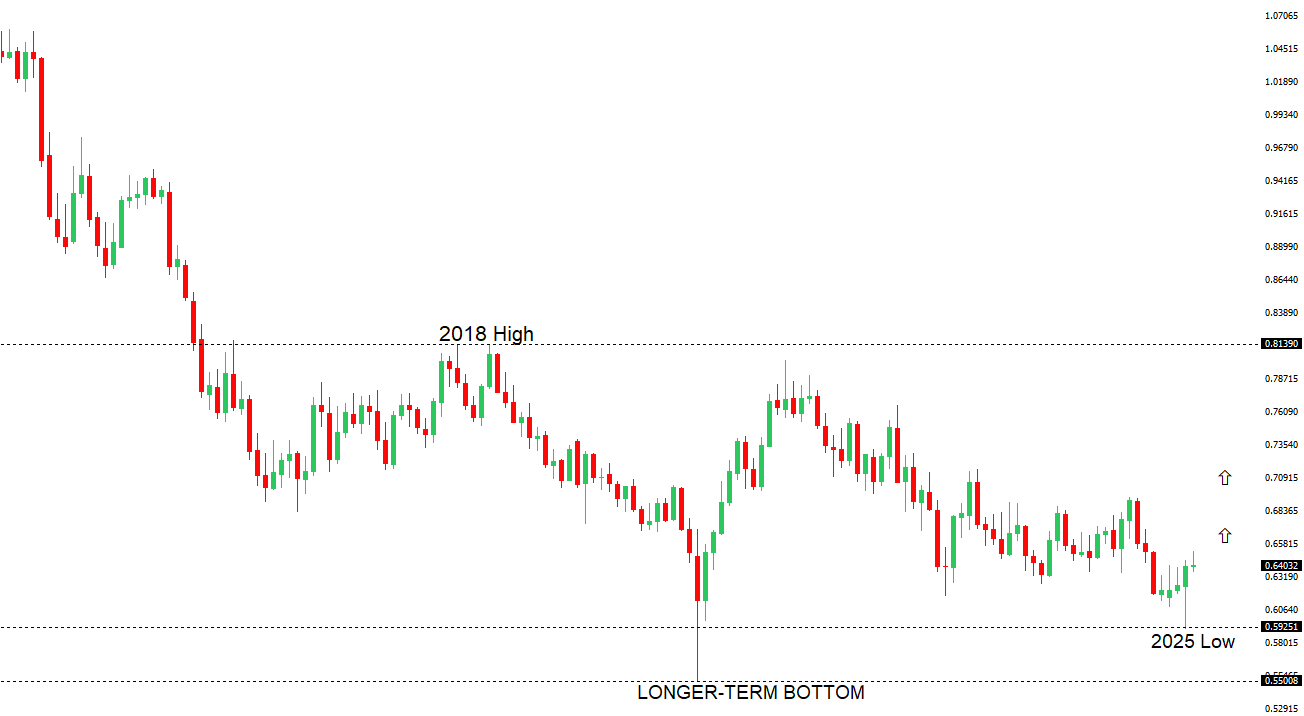 | ||
| R2 0.6550 - 25 November high - Strong R1 0.6515 - 7 May/2025 high - Medium S1 0.6344 - 24 April low - Medium S1 0.6275 - 14 April low - Strong | ||
| AUDUSD: fundamental overview | ||
| Reserve Bank of Australia Deputy Governor Andrew Hauser stated that the RBA is ready to implement policy measures if the global impact of Trump administration tariffs significantly affects Australia, though current forward indicators show no major local disruptions. He noted that many Australian firms view the U.S.-China trade tensions as an opportunity to strengthen their competitive position in the Chinese market. | ||
| Suggested reading | ||
| Japan’s population crisis reaches tipping point, T. Griggs, Financial Times (May 23, 2025) Investors should be more worried about Japan, V. Chen, MarketWatch (May 22, 2025) | ||