


 | ||
| 26th May 2025 | view in browser | ||
| Trump tariffs spark market jitters….again | ||
| Global markets face a turbulent landscape as Trump’s trade threats, rising bond yields, and shifting monetary policies in Japan and the U.S. drive uncertainty, with U.S. and UK market closures for Memorial Day and Spring Bank Holiday amplifying volatility ahead of key economic data releases. | ||
| Performance chart 30day v. USD (%) | ||
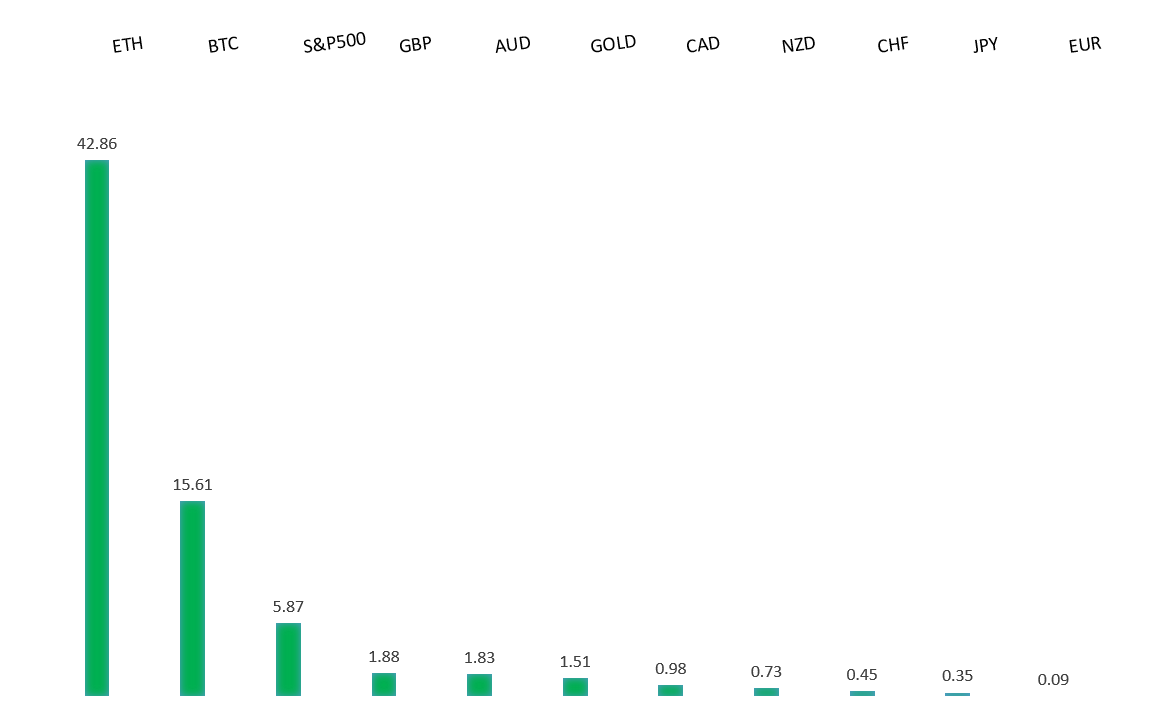 | ||
| Technical & fundamental highlights | ||
| EURUSD: technical overview | ||
| The Euro has finally broken out from a multi-month consolidation off a critical longer-term low. This latest push through the 2023 high lends further support to the case for a meaningful bottom, setting the stage for a bullish structural shift and the next major upside extension targeting the 2021 high at 1.2350. Setbacks should be exceptionally well supported below 1.1000. | ||
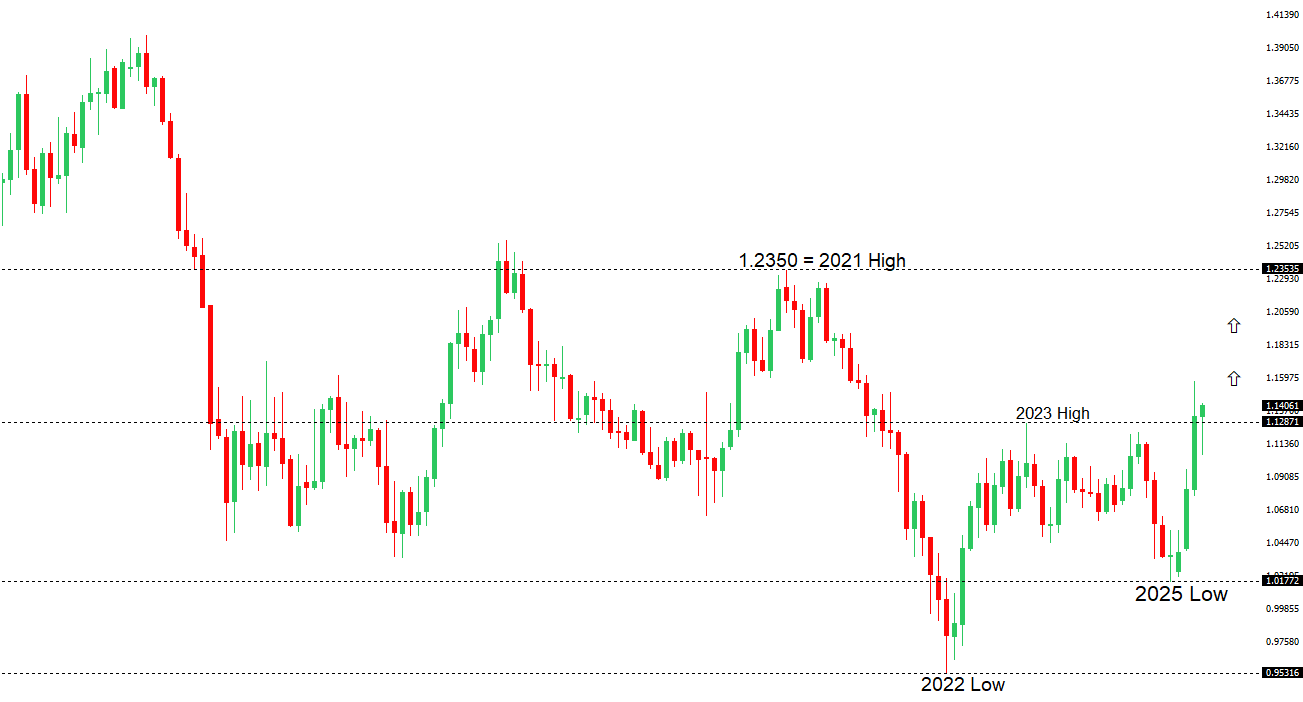 | ||
| R2 1.1474 - 11 April high - Medium R1 1.1419 - 26 May high - Medium S1 1.1131 - 16 May low - Medium S2 1.1065 - 12 May low - Medium | ||
| EURUSD: fundamental overview | ||
| Initially, tariff threats from former President Trump caused the U.S. dollar to strengthen against other currencies, but his recent proposal to impose tariffs on European goods unexpectedly boosted the Euro against the dollar. Despite expectations of stable 10% tariffs and upcoming trade deals before the July deadline, markets were reminded of ongoing trade war uncertainties, prompting a shift toward safe-haven assets. Meanwhile, Eurozone wage growth slowed to 2.4% in Q1 from 4.1% in Q4 2024, signaling cooling service prices and reinforcing ECB confidence in reaching their 2% inflation target, with an expected rate cut on June 5 and traders anticipating 2-3 additional cuts this year. Key upcoming data includes Germany’s June Gfk Consumer Confidence, May inflation figures from several EU countries, and EU-wide confidence surveys. | ||
| USDJPY: technical overview | ||
| There are signs of a meaningful top in place after the market put in a multi-year high in 2024. At this point, the door is now open for a deeper setback below the 2024 low at 139.58 over the coming sessions exposing a retest of the 2023 low. Rallies should be well capped below 150.00. | ||
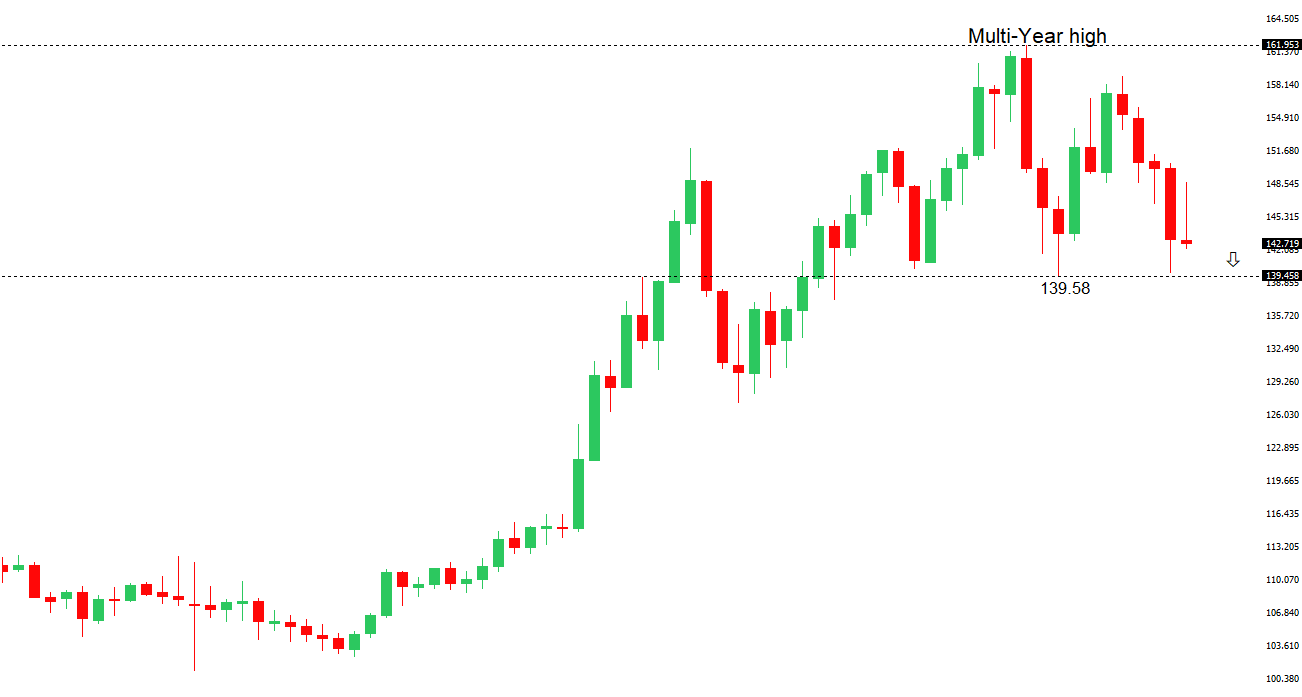 | ||
| R2 148.65 - 12 May high - Medium R1 146.19 - 9 May high - Medium S1 142.23 - 26 May low - Medium S2 141.97 - 29 April low - Medium | ||
| USDJPY: fundamental overview | ||
| Japanese government bond yields, particularly for 20-year and 30-year bonds, have surged to record highs of 2.605% and 3.204%, respectively, raising concerns about a potential yen carry trade unwind as Japanese investors may repatriate capital from global assets like U.S. Treasuries and equities. April’s core inflation rose to 3.5% year-on-year, exceeding expectations, with persistent price pressures from food, labor, and energy, and upcoming Tokyo CPI data for May likely to show further increases, intensifying pressure on the Bank of Japan for a potential rate hike. However, weak domestic demand and a possible technical recession complicate the BOJ’s decision, with a narrow window for action before the July election and “Liberation Day” tariff deadline. Japan’s trade negotiations with the U.S., including discussions around auto tariffs and Nippon Steel’s proposed $14.1 billion acquisition of U.S. Steel, could influence BOJ policy if resolved favorably by the G7 meeting in June. This week, investors will watch Japan’s 40-year bond auction, BOJ bond-buying operations, and April PPI Services data, expected to show a 3.0% year-on-year rise, reflecting ongoing pricing pressures tempered by low business confidence. | ||
| AUDUSD: technical overview | ||
| There are signs of the potential formation of a longer-term base with the market trading down into a meaningful longer-term support zone. Only a monthly close below 0.5500 would give reason for rethink. A monthly close back above 0.7000 will take the big picture pressure off the downside and strengthen case for a bottom. | ||
 | ||
| R2 0.6550 - 25 November 2024 high - Strong R1 0.6538 - 26 May/2025 high - Medium S1 0.6344 - 24 April low - Medium S1 0.6275 - 14 April low - Strong | ||
| AUDUSD: fundamental overview | ||
| President Trump’s recent threats of 50% tariffs on European imports and 25% duties on foreign-made smartphones have reignited market concerns about trade uncertainties tied to the “Liberation Day” tariffs, leading to a weaker U.S. dollar and gains for the Australian Dollar. Reserve Bank of Australia Deputy Governor Andrew Hauser noted that while Australia has seen little direct impact from global trade disruptions so far, the RBA is ready to adjust policy if needed, and some Australian firms see opportunities to gain a competitive edge in China due to U.S.-China trade tensions. Australian inflation data, due Wednesday, is expected to soften, supporting predictions of RBA rate cuts later this year, with major banks forecasting a year-end cash rate of 3.10% to 3.35%. | ||
| Suggested reading | ||
| OpenAI Make a Long-Shot Bet to Kill the iPhone, D. Lee, Bloomberg (May 24, 2025) America’s Sports Betting Boom Is About to Backfire, N. Devor, Barrons (May 23, 2025) | ||