


 | ||
| 17th June 2026 | view in browser | ||
| All eyes on Warsh as markets search for direction | ||
| Markets enter Wednesday in consolidation mode, with easing Middle East tensions supporting risk appetite, but the Fed’s first decision under Chair Warsh standing as the key catalyst that could reshape investor expectations. | ||
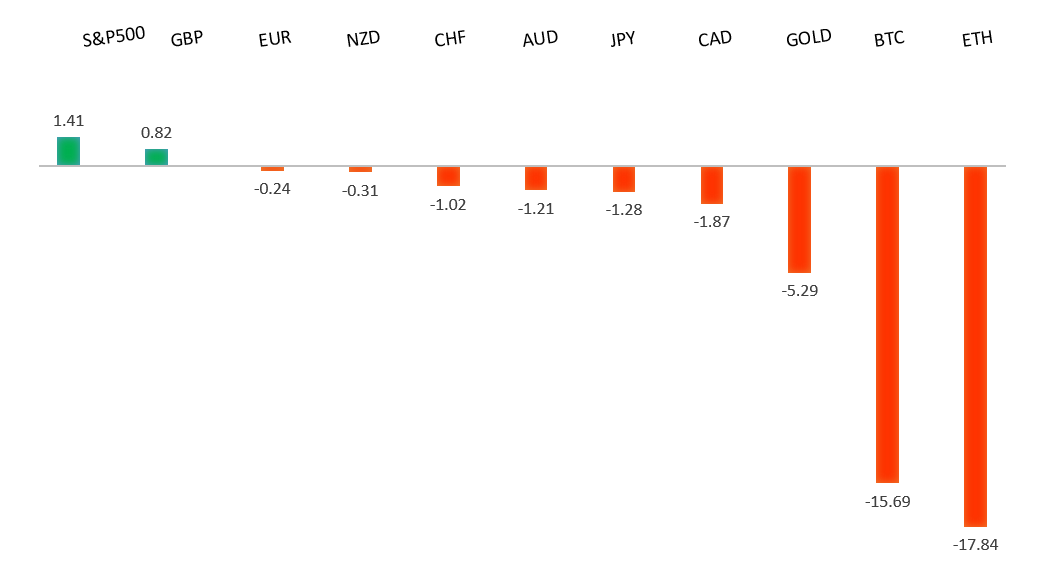
| Performance chart 30day v. USD (%) | ||
 | ||
| Technical & fundamental highlights | ||
| EURUSD: technical overview | ||
| The Euro outlook remains constructive with higher lows sought out on dips in favor of the next major upside extension targeting the 2021 high at 1.2350. Setbacks should be exceptionally well supported ahead of 1.1300. | ||
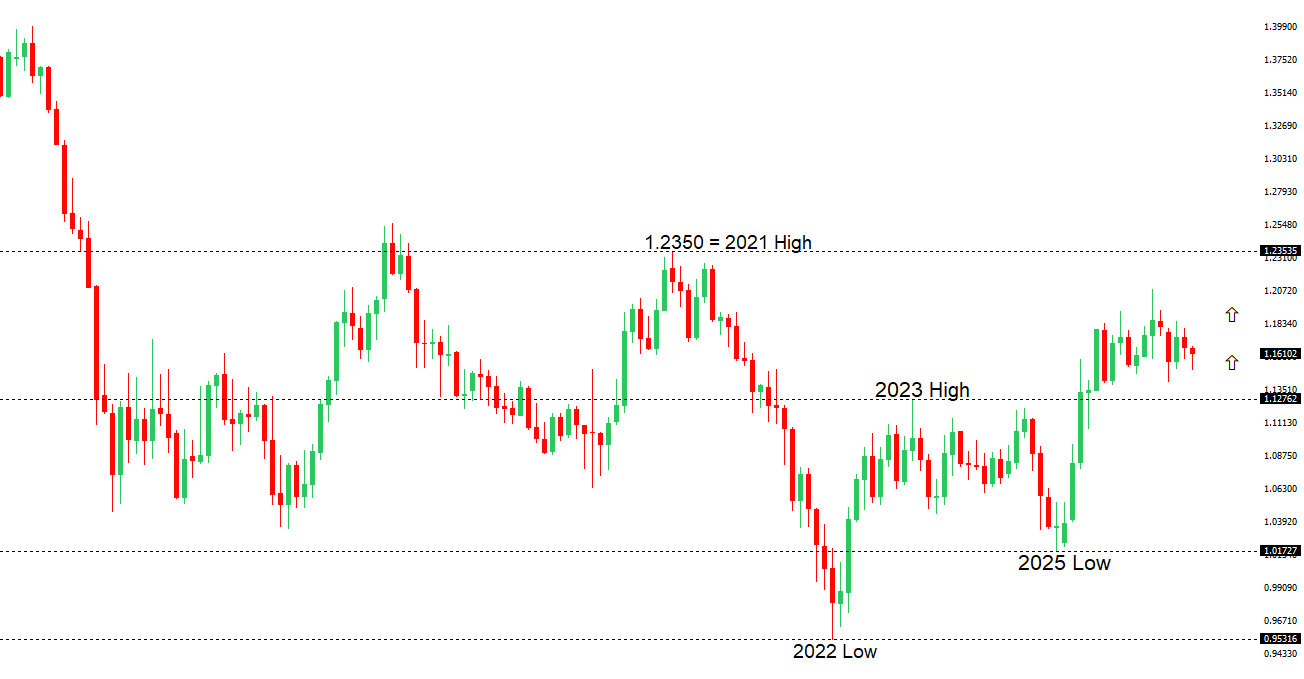 | ||
| R2 1.1686 - 29 May high - Strong R1 1.1646 - 4 June high - Medium S1 1.1557 - 12 June low - Medium S2 1.1500 - 8 June low - Strong | ||
| EURUSD: fundamental overview | ||
| The euro has remained underpinned by an increasingly hawkish ECB backdrop, even as EURUSD trades in a relatively narrow range ahead of the Federal Reserve decision. The ECB has already delivered its first rate hike since 2023, lifting the deposit rate to 2.25%, while policymakers, including President Lagarde, have signaled that further tightening remains possible as they seek to prevent elevated energy costs from feeding into broader inflation pressures. Markets continue to price in additional ECB hikes this year, supported by core inflation holding around 2.5% and improving sentiment indicators such as Germany’s ZEW expectations survey. At the same time, attention has shifted toward the Fed, where an expected hold has left investors focused on the policy outlook and whether US officials acknowledge that easing energy prices following progress toward a US-Iran agreement could lessen inflation risks going forward. This dynamic has modestly improved the Euro’s relative rate appeal, although lingering geopolitical uncertainty in the Middle East and any renewed demand for the safe-haven US Dollar continue to act as headwinds. In the near term, the euro’s direction will hinge on whether the ECB reinforces expectations for further policy tightening while the Fed maintains a cautious stance, potentially widening the policy divergence in the single currency’s favor. | ||
| GBPUSD: technical overview | ||
| The Pound remains exceptionally well supported on dips into the 1.3000 area, with the price largely consolidating above the psychological barrier and previous resistance turned support in the form of the 2023 high. Look for the market to continue be well supported on dips ahead of the next major upside extension through the yearly high at 1.3870 and towards a retest of the 2018 high at 1.4377 further up. Only a monthly close below 1.3000 negates. | ||
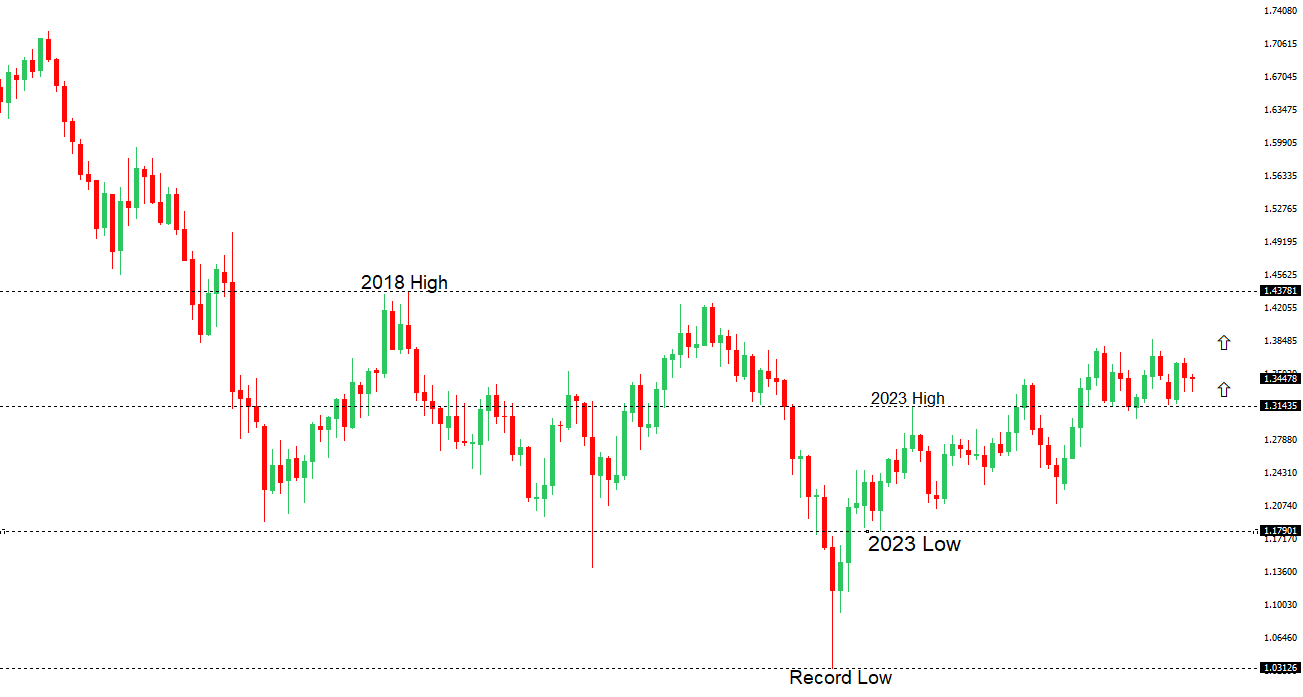 | ||
| R2 1.3509 - 25 May high - Strong R1 1.3486 - 29 May high - Medium S1 1.3383 - 12 June low - Strong S2 1.3302 - 18 May low - Strong | ||
| GBPUSD: fundamental overview | ||
| Sterling has been supported by an improving global risk backdrop following renewed optimism surrounding a US-Iran peace agreement, which has weighed on safe-haven demand for the US Dollar and helped lift risk-sensitive currencies. At the same time, traders are bracing for a pivotal stretch of UK event risk, with May CPI data and the Bank of England policy decision set to shape expectations for the policy path ahead. Markets have increasingly scaled back expectations for aggressive BoE easing, particularly after elevated energy prices threatened to reignite inflation pressures, even as softer UK growth data has highlighted the difficult balancing act facing policymakers. On the external front, attention is firmly on the Federal Reserve, where rates are widely expected to remain unchanged, with investors instead focused on updated economic projections and guidance on the timing of future policy moves. As a result, the Pound has remained relatively resilient, trading in tight ranges as investors await clarity from both central banks while broader sentiment continues to be influenced by developments in global geopolitics and their implications for inflation and growth. | ||
| USDJPY: technical overview | ||
| There are signs of the formation of a meaningful top after the market put in a multi-year high in 2024. At this point, rallies should be well capped above 160.00 in favor of a fresh down-leg back towards the 2024 low at 139.58. Only a monthly close above 160.00 negates. | ||
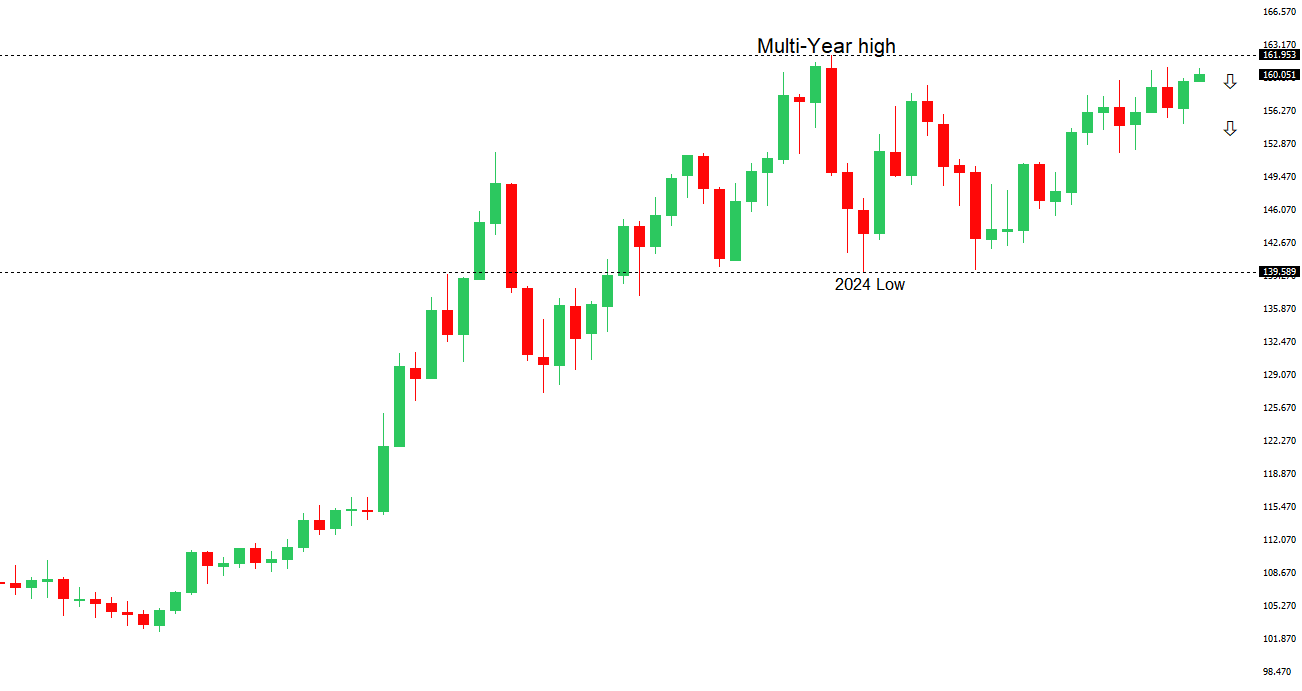 | ||
| R2 160.73 - 30 April/2026 high - Strong R1 160.60 - 11 June high - Strong S1 159.54 - 11 June low - Medium S2 158.59 - 20 May low - Medium | ||
| USDJPY: fundamental overview | ||
| The Yen remains primarily driven by the evolving policy divergence between the Bank of Japan and the Federal Reserve. Although the BoJ delivered a widely anticipated 25 basis point rate hike to 1.00%—its highest policy rate since 1995—the move has failed to generate sustained support for the Yen as Japanese interest rates remain well below those in the United States. Market participants have also interpreted Deputy Governor Uchida’s cautious post-meeting communication as signaling a gradual approach to any further policy normalization, limiting expectations for additional tightening this year. Concerns that higher energy prices linked to Middle East developments could weigh on Japan’s growth outlook, alongside expectations for more accommodative fiscal measures aimed at easing the burden of elevated living costs, have further undermined the currency. At the same time, optimism surrounding a potential US-Iran peace agreement has reduced safe-haven demand for the Yen, while the US Dollar itself has softened ahead of the Federal Reserve policy decision. Nevertheless, with USDJPY continuing to trade just below the closely watched 160.50 area, markets remain alert to the risk of official intervention should Yen weakness accelerate further. | ||
| AUDUSD: technical overview | ||
| There are signs of the formation of a longer-term base with the market recovering out from a meaningful longer-term support zone. The latest monthly close back above 0.7000 takes the big picture pressure off the downside and strengthens the case for a bottom, with the focus now on a push towards 0.8000. Setbacks should now be well supported ahead of 0.6700. | ||
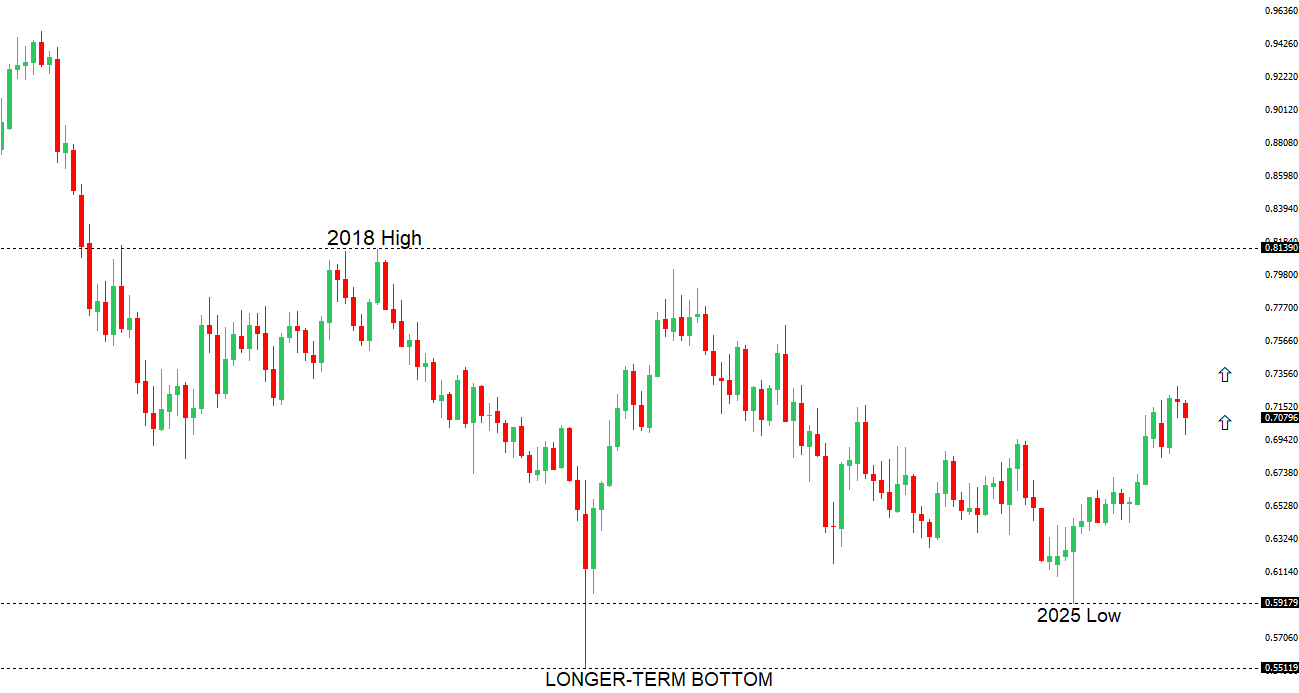 | ||
| R2 0.7201 - 29 May high - Strong R1 0.7100 - Figure - Medium S1 0.6979 - 11 June low - Medium S2 0.6963 - 8 April low - Strong | ||
| AUDUSD: fundamental overview | ||
| The Australian Dollar remains underpinned by a combination of resilient domestic fundamentals, a still-cautious Reserve Bank of Australia, and an improvement in global risk sentiment following signs of a temporary easing in Middle East tensions. The RBA’s decision to keep rates unchanged at 4.35% this week was accompanied by a distinctly hawkish message, with Governor Bullock reiterating that inflation remains too high and that further tightening cannot be ruled out if price pressures prove persistent. While Australia’s economy has shown signs of moderation, with softer GDP growth and some cooling in the labor market, inflation remains sticky enough to keep the prospect of restrictive policy firmly in place. Externally, optimism surrounding a US-Iran memorandum aimed at reopening the Strait of Hormuz has supported risk-sensitive currencies such as the Aussie by weighing on safe-haven demand for the US Dollar. Meanwhile, China, Australia’s largest trading partner, continues to provide stability rather than a meaningful growth impulse, with policymakers maintaining an accommodative stance and signalling readiness to preserve liquidity and financial stability. That said, markets remain cautious ahead of the Federal Reserve decision, where any shift in the Fed’s policy outlook could ultimately determine whether AUDUSD can build on its recent recovery above 0.7050 or remains confined within its recent range. | ||
| Suggested reading | ||
| It Is the Humble Investor Who Quietly Survives, J. Calhoun, Alhambra (June 14, 2026) Smart Investors vs. Dumb Investors, B. Carlson, A Wealth of Common Sense (June 14, 2026) | ||