


 | ||
| 18th June 2026 | view in browser | ||
| Life after forward guidance | ||
| Markets head into the new day focused on growing uncertainty around the Fed’s new policy framework under Chair Warsh, with a hawkish repricing supporting the Dollar, pressuring risk assets, and leaving investors highly sensitive to incoming economic and central bank developments. | ||
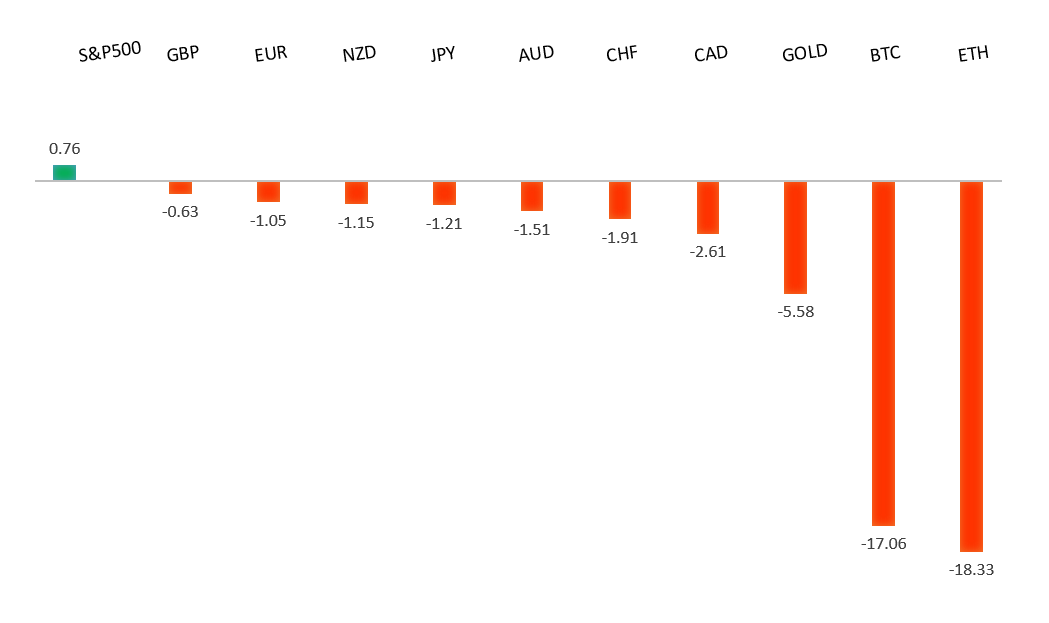
| Performance chart 30day v. USD (%) | ||
 | ||
| Technical & fundamental highlights | ||
| EURUSD: technical overview | ||
| The Euro outlook remains constructive with higher lows sought out on dips in favor of the next major upside extension targeting the 2021 high at 1.2350. Setbacks should be exceptionally well supported ahead of 1.1300. | ||
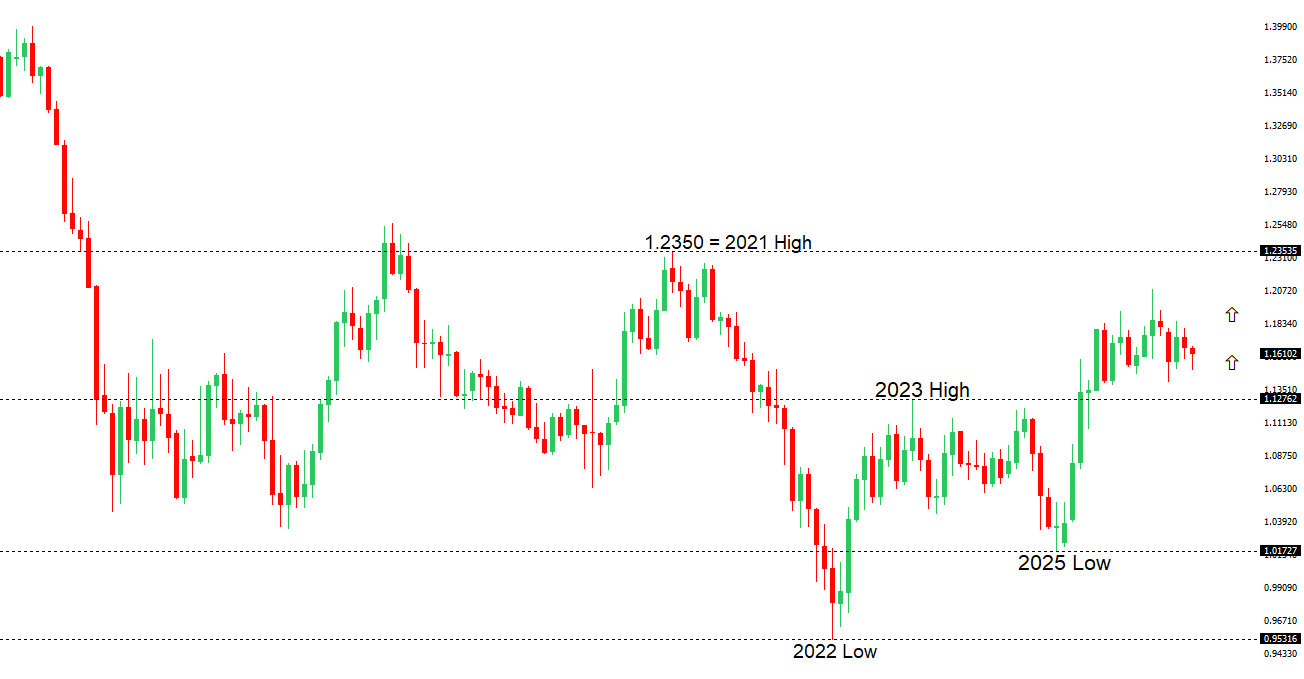 | ||
| R2 1.1686 - 29 May high - Strong R1 1.1623 - 15 June high - Strong S1 1.1500 - Figure - Medium S2 1.1478 - 17 June low - Strong | ||
| EURUSD: fundamental overview | ||
| The euro remains primarily driven by the contrast between a newly hawkish Federal Reserve and an ECB that is still viewed as being closer to the end of its tightening cycle. EURUSD came under heavy pressure after the Fed’s June decision, with Chair Kevin Warsh overseeing a hold but delivering a significantly more hawkish message through updated projections that shifted the expected 2026 policy path from rate cuts toward the possibility of further tightening. Markets rapidly repriced Fed expectations, with investors now seeing a meaningful chance of higher U.S. rates later this year, widening the yield advantage in favor of the dollar and weighing on the euro. At the same time, improving risk sentiment following the U.S.-Iran peace agreement has offered some support to the single currency, helping EURUSD recover from post-Fed losses as easing geopolitical tensions reduce demand for traditional safe havens. Overall, while the euro continues to draw some support from resilient Eurozone growth and the ECB’s efforts to keep inflation contained, the dominant near-term driver remains the prospect of a more restrictive Fed policy stance, which has shifted interest rate differentials back in the dollar’s favor and limited upside for EURUSD. | ||
| GBPUSD: technical overview | ||
| The Pound remains exceptionally well supported on dips into the 1.3000 area, with the price largely consolidating above the psychological barrier and previous resistance turned support in the form of the 2023 high. Look for the market to continue be well supported on dips ahead of the next major upside extension through the yearly high at 1.3870 and towards a retest of the 2018 high at 1.4377 further up. Only a monthly close below 1.3000 negates. | ||
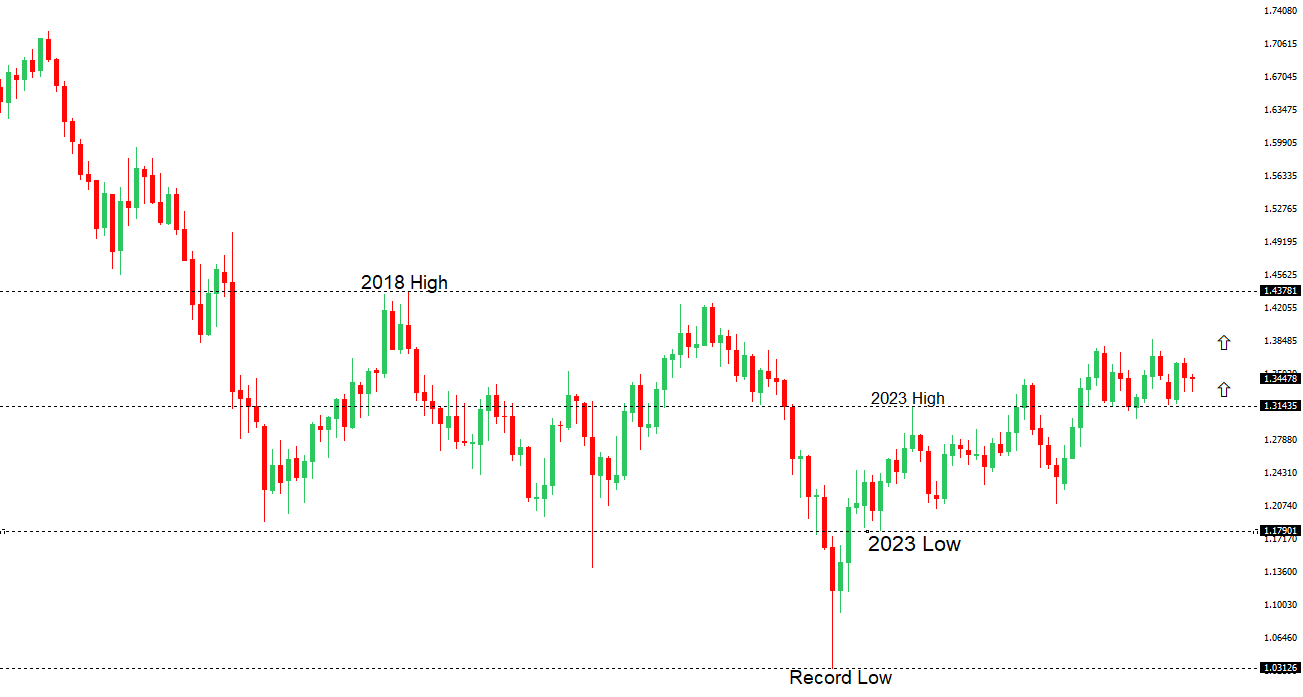 | ||
| R2 1.3509 - 25 May high - Strong R1 1.3400 - Figure - Medium S1 1.3300 - Figure - Medium S2 1.3262 - 17 June low - Strong | ||
| GBPUSD: fundamental overview | ||
| The pound has come under pressure from a combination of softer domestic inflation and a more hawkish shift from the Federal Reserve. UK May CPI data reinforced the view that inflation pressures are gradually easing, with core inflation slowing to 2.6% year-over-year and monthly price growth undershooting expectations, prompting markets to scale back expectations for additional Bank of England tightening. Attention now turns to the BoE decision, where rates are widely expected to remain unchanged, though investors will closely watch the vote split and guidance for clues on the future policy path. At the same time, sterling has been weighed down by broad US Dollar strength after the Fed delivered a hawkish hold, removed its easing bias, and projected a higher rate path, fueling expectations that the next Fed move could be a hike rather than a cut. More recently, hopes surrounding a US-Iran peace agreement and the reopening of the Strait of Hormuz have encouraged some profit-taking in the Dollar and allowed GBPUSD to stabilize off recent lows, though the broader backdrop remains challenging for the pound as narrowing UK rate expectations contrast with a more restrictive Fed outlook. | ||
| USDJPY: technical overview | ||
| There are signs of the formation of a meaningful top after the market put in a multi-year high in 2024. At this point, rallies should be well capped above 160.00 in favor of a fresh down-leg back towards the 2024 low at 139.58. Only a monthly close above 160.00 negates. | ||
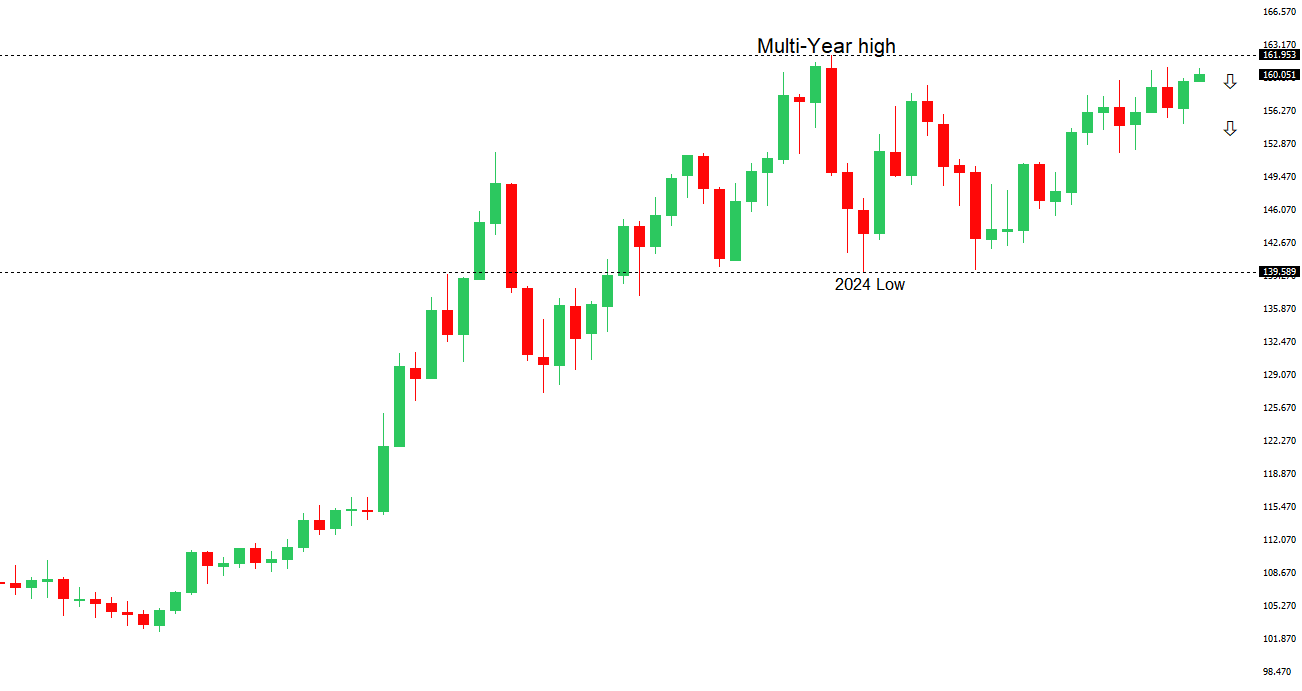 | ||
| R2 161.00 - Figure - Strong R1 160.80 - 17 June/2026 high - Strong S1 159.54 - 11 June low - Medium S2 158.59 - 20 May low - Medium | ||
| USDJPY: fundamental overview | ||
| The Yen remains under pressure primarily because of the widening policy divergence between the Bank of Japan and the Federal Reserve. While the BoJ recently raised rates to 1.0%, its highest level since 1995, Japanese yields remain far below those in the United States, preserving the attractiveness of Yen-funded carry trades. The latest catalyst for renewed Yen weakness came from the Federal Reserve’s hawkish hold, with the updated dot plot signaling one additional rate hike this year and new Fed Chair Kevin Warsh emphasizing that inflation remains too high and that policymakers remain fully committed to restoring price stability. This pushed US yields and the Dollar higher, driving USDJPY above 160. At the same time, Japanese officials have stepped up verbal intervention warnings, with Chief Cabinet Secretary Kihara reiterating that authorities stand ready to respond appropriately to excessive currency moves, helping to slow the Yen’s decline. More recently, optimism surrounding a US-Iran peace agreement and the reopening of the Strait of Hormuz has tempered safe-haven demand for the Dollar and encouraged some profit-taking in USDJPY. Nevertheless, with the US-Japan yield differential still exceptionally wide and uncertainty lingering over the pace of future BoJ tightening, the fundamental backdrop continues to favor Dollar strength against the Yen, even as intervention risks become increasingly elevated near current levels. | ||
| AUDUSD: technical overview | ||
| There are signs of the formation of a longer-term base with the market recovering out from a meaningful longer-term support zone. The latest monthly close back above 0.7000 takes the big picture pressure off the downside and strengthens the case for a bottom, with the focus now on a push towards 0.8000. Setbacks should now be well supported ahead of 0.6700. | ||
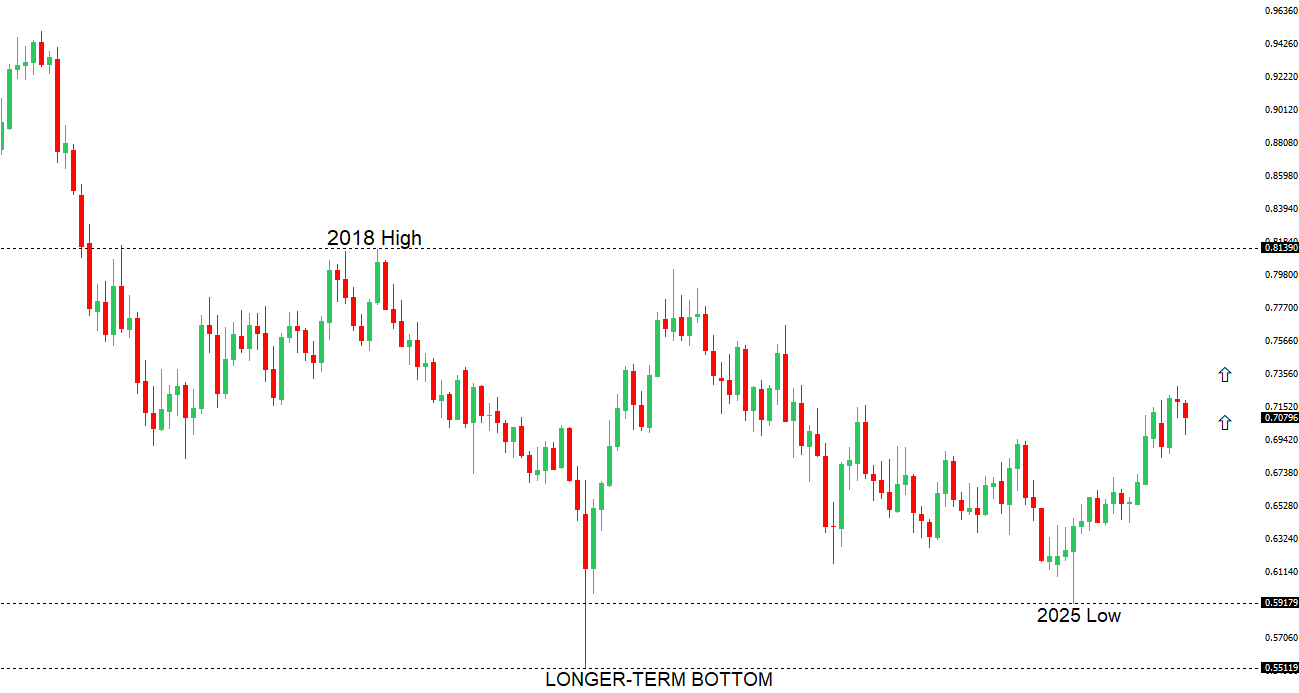 | ||
| R2 0.7201 - 29 May high - Strong R1 0.7089 - 15 June high - Medium S1 0.6979 - 11 June low - Medium S2 0.6963 - 8 April low - Strong | ||
| AUDUSD: fundamental overview | ||
| The Australian Dollar remains broadly supported by the Reserve Bank of Australia’s relatively hawkish stance, but near-term price action has been dominated by shifts in US interest rate expectations and global risk sentiment. While the RBA has kept the cash rate unchanged at 4.35%, policymakers continue to warn that further tightening remains possible if inflation proves persistent, helping underpin the Aussie from a domestic perspective. More recently, however, AUDUSD came under pressure after the Federal Reserve delivered a hawkish hold, with updated projections showing higher inflation expectations and a shift toward a more restrictive policy path under new Chair Kevin Warsh, widening the yield advantage in favor of the US Dollar. At the same time, improving risk appetite following progress toward a US-Iran ceasefire framework and the reopening of the Strait of Hormuz has offered some relief to the Aussie given its sensitivity to global growth and market sentiment. With Australia’s economic calendar relatively light and domestic fundamentals largely unchanged, the Australian Dollar is currently taking its cues from Fed policy expectations, broader US Dollar direction, and swings in global risk appetite, while the RBA’s willingness to maintain a restrictive policy bias continues to provide an underlying source of support. | ||
| Suggested reading | ||
| How Uzbekistan could liberalise its economy with a push into green energy, FT (June 18, 2026) Why Most Stocks Aren’t Worth Owning, D. Lefkovitz, Morningstar (June 17, 2026) | ||