


 | ||
| 5th September 2025 | view in browser | ||
| US jobs report and Fed implications | ||
| Friday’s US jobs report is expected to significantly influence markets, with forecasts suggesting modest job growth. Of course, all eyes will be on investor sentiment in the aftermath and how this impact Fed pricing. | ||
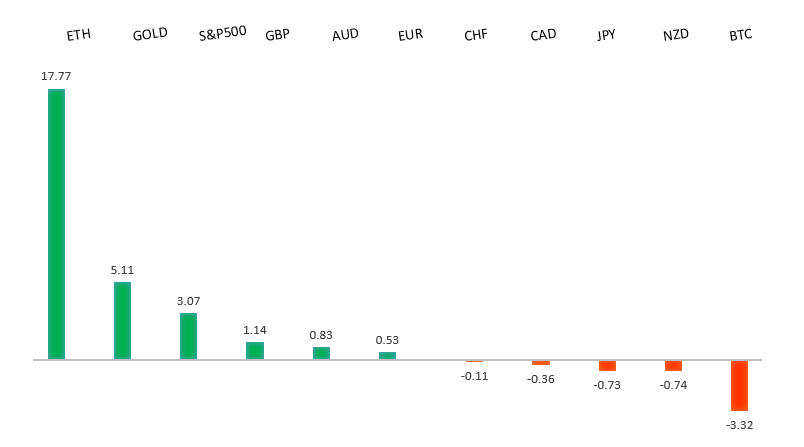
| Performance chart 30day v. USD (%) | ||
 | ||
| Technical & fundamental highlights | ||
| EURUSD: technical overview | ||
| The Euro has broken out from a multi-month consolidation off a critical longer-term low. This latest push through the 2023 high (1.1276) lends further support to the case for a meaningful bottom, setting the stage for a bullish structural shift and the next major upside extension targeting the 2021 high at 1.2350. Setbacks should be exceptionally well supported ahead of 1.1000. | ||
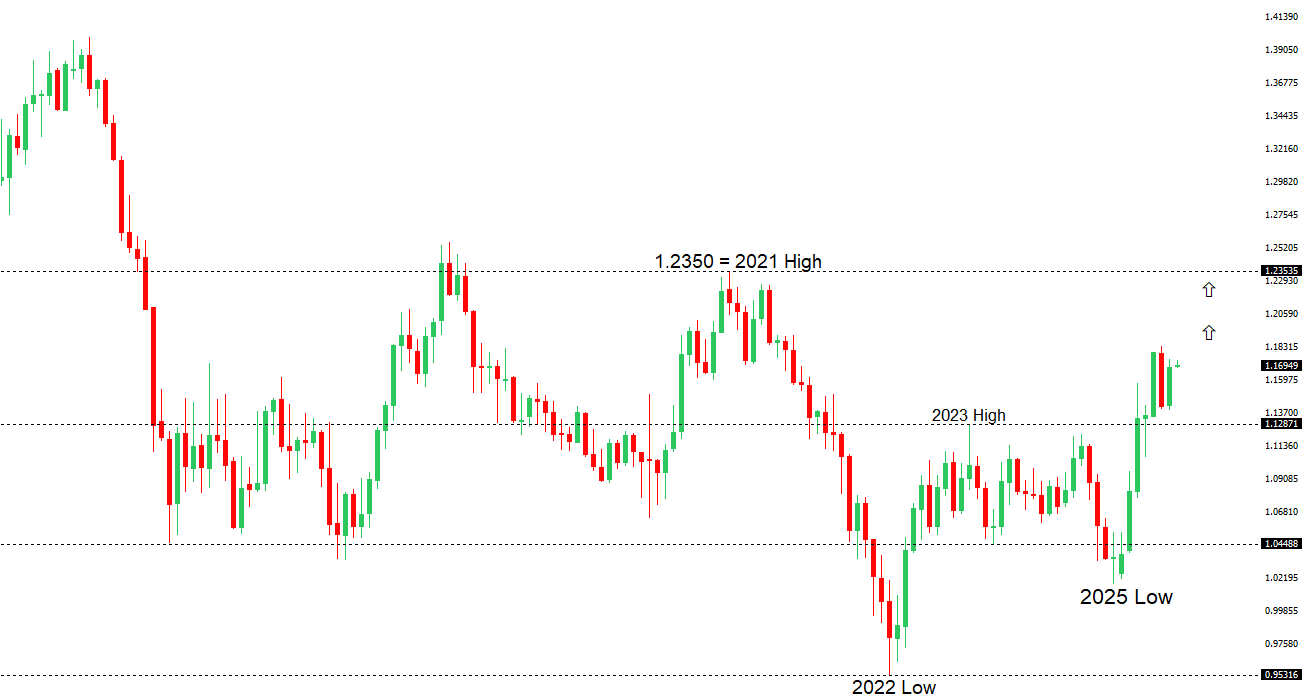 | ||
| R2 1.1789 - 24 July high - Medium R1 1.1743 - 22 August high - Medium S1 1.1583 - 22 August low - Medium S2 1.1392 - 1 August low - Strong | ||
| EURUSD: fundamental overview | ||
| The euro is stabilizing amid mixed economic signals, with recent retail sales in the Eurozone dropping sharply by 0.5% in July 2025, driven by declines in food and fuel sales, while the construction sector continues to contract despite slight improvements. European stocks have shown resilience, with gains in technology shares, though concerns linger over fiscal challenges, political risks in France, and persistent pessimism in the construction sector. The European Central Bank is likely to maintain steady interest rates, contrasting with expected Federal Reserve rate cuts, putting pressure on the euro, especially as markets await the critical US Nonfarm Payrolls report, which could influence direction. | ||
| USDJPY: technical overview | ||
| There are signs of a meaningful top in place after the market put in a multi-year high in 2024. At this point, the door is now open for a deeper setback below the 2024 low at 139.58, exposing a retest of the 2023 low. Rallies should be well capped below 152.00. | ||
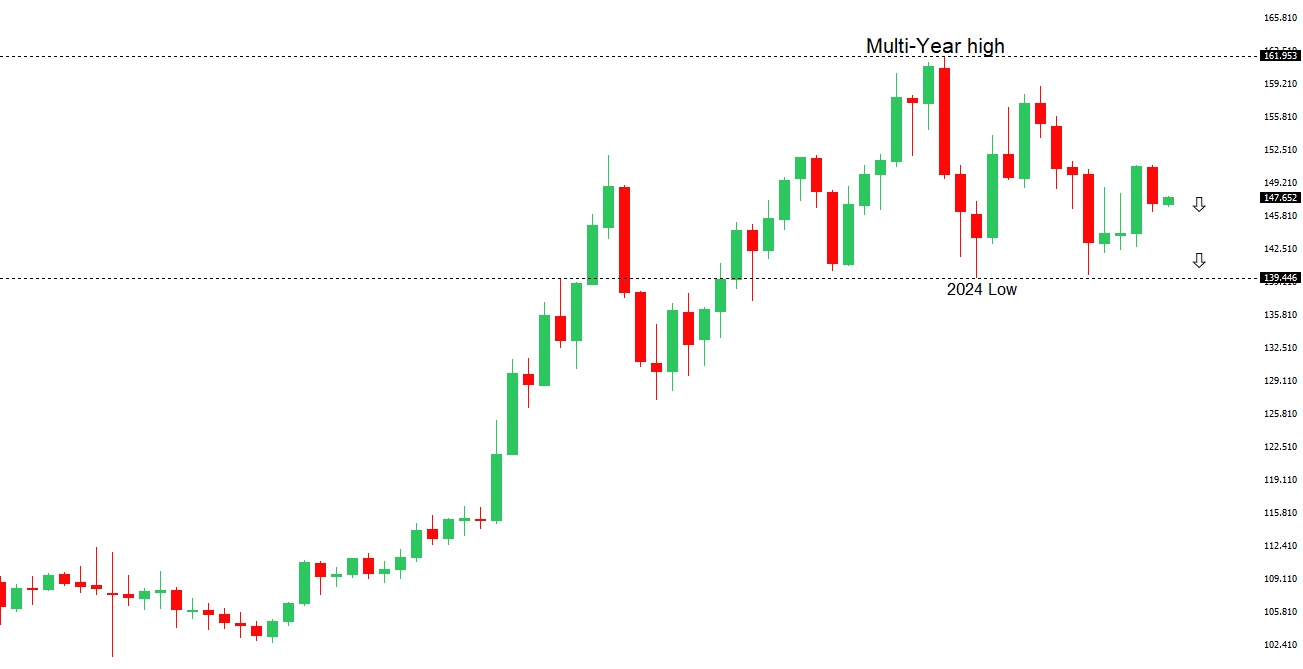 | ||
| R2 150.92 - 1 August high - Strong R1 149.14 - 3 September high - Medium S1 146.21 - 14 August low - Medium S2 145.85 - 24 July low - Strong | ||
| USDJPY: fundamental overview | ||
| The Nikkei 225 Index surged, and the Topix Index rose, driven by a tech-led rally mirroring Wall Street, with strong performances from companies like SoftBank and Advantest. Japan’s 10-year bond yield dipped to 1.58% after hitting a 17-year high, while robust wage growth of 4.1% in July and rising household spending supported expectations of a potential Bank of Japan rate hike. Japan’s foreign reserves hit $1.32 trillion, bolstered by valuation effects, and lower US tariffs on Japanese autos, alongside $550 billion in investment, eased pressure on the auto sector. Political uncertainty grew with the resignation of a key ally of Prime Minister Ishiba, potentially impacting BOJ policy, while the yen remained stable against the dollar. | ||
| AUDUSD: technical overview | ||
| There are signs of the potential formation of a longer-term base with the market trading down into a meaningful longer-term support zone. Only a monthly close below 0.5500 would give reason for rethink. A monthly close back above 0.7000 will take the big picture pressure off the downside and strengthen case for a bottom. | ||
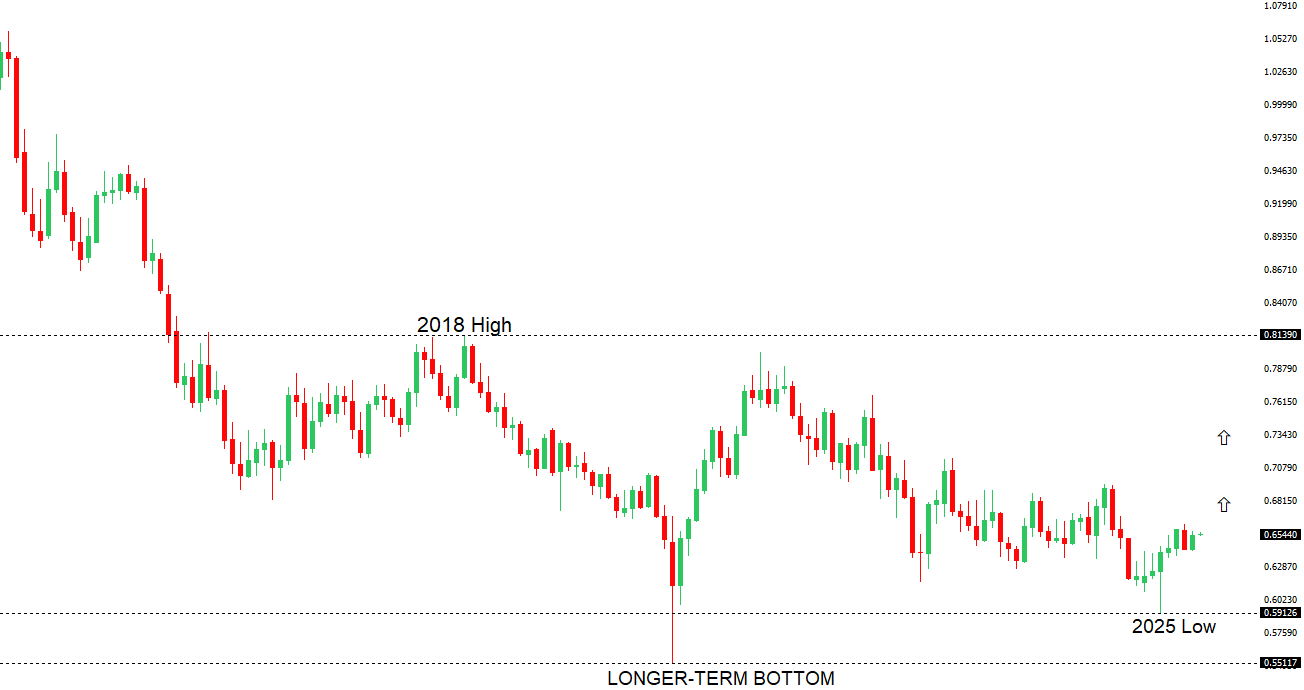 | ||
| R2 0.6600 - Figure - Medium R1 0.6569 - 14 August high - Medium S1 0.6414 - 22 August low - Medium S1 0.6373 - 23 June low - Strong | ||
| AUDUSD: fundamental overview | ||
| The Australian dollar is under pressure despite strong domestic economic data, largely due to a resilient U.S. dollar as markets await the U.S. Nonfarm Payrolls report. Australia’s trade surplus surged to A$7.31 billion in July, driven by robust exports and weaker imports, while household spending rose 5.1% year-on-year, supported by solid GDP growth of 0.6% in the June quarter. Despite these positives, the Reserve Bank of Australia is likely to maintain current interest rates, though analysts predict potential rate cuts in 2025 and 2026. The S&P/ASX 200 rallied, led by strong performances in financials and mining stocks. | ||
| Suggested reading | ||
| The Ugly History Of Government Meddling In Business, K. Pringle, Barron’s (September 3, 2025) Bonds are a disaster. Why you may want to buy more, B. Arends, MarketWatch (September 4, 2025) | ||