


 | ||
| 7th September 2025 | view in browser | ||
| Fed rate cuts expected after weak jobs report | ||
| The US dollar index dropped as Treasury yields fell after a disappointing August jobs report showed only 22,000 nonfarm payrolls added, far below the expected 75,000, with the unemployment rate rising to 4.3%, the highest since October 2021. | ||
| Performance chart 30day v. USD (%) | ||
 | ||
| Technical & fundamental highlights | ||
| EURUSD: technical overview | ||
| The Euro has broken out from a multi-month consolidation off a critical longer-term low. This latest push through the 2023 high (1.1276) lends further support to the case for a meaningful bottom, setting the stage for a bullish structural shift and the next major upside extension targeting the 2021 high at 1.2350. Setbacks should be exceptionally well supported ahead of 1.1000. | ||
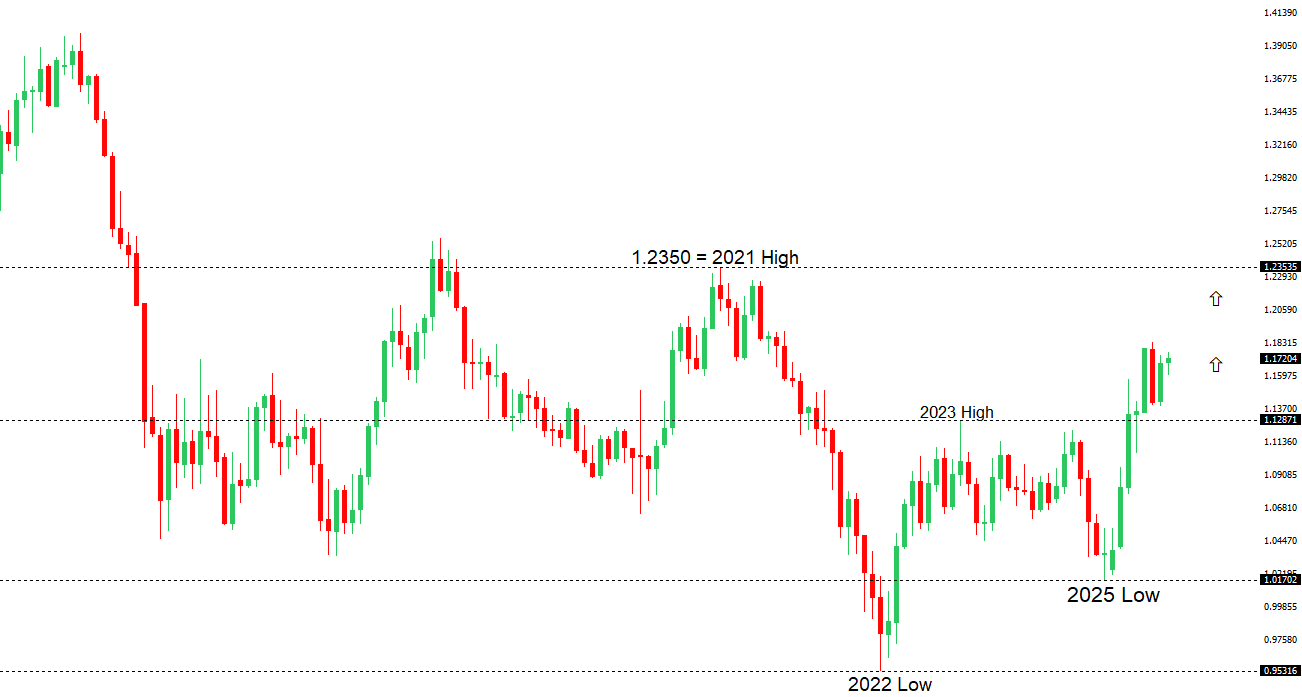 | ||
| R2 1.1789 - 24 July high - Medium R1 1.1760 - 5 September high - Medium S1 1.1583 - 22 August low - Medium S2 1.1392 - 1 August low - Strong | ||
| EURUSD: fundamental overview | ||
| The euro surged to its highest since late July, due to a weakened US dollar following disappointing US jobs data, which has solidified expectations for Federal Reserve rate cuts in 2025. European stock markets, including the STOXX 50 and STOXX 600, declined slightly, reflecting concerns about the US economy and a stronger euro impacting export-driven companies like Siemens and Airbus. The Eurozone economy grew 1.5% annually in Q2 2025, but quarterly growth slowed to 0.1%, with Germany and Italy seeing GDP contractions, while employment continued to rise modestly. | ||
| USDJPY: technical overview | ||
| There are signs of a meaningful top in place after the market put in a multi-year high in 2024. At this point, the door is now open for a deeper setback below the 2024 low at 139.58, exposing a retest of the 2023 low. Rallies should be well capped below 152.00. | ||
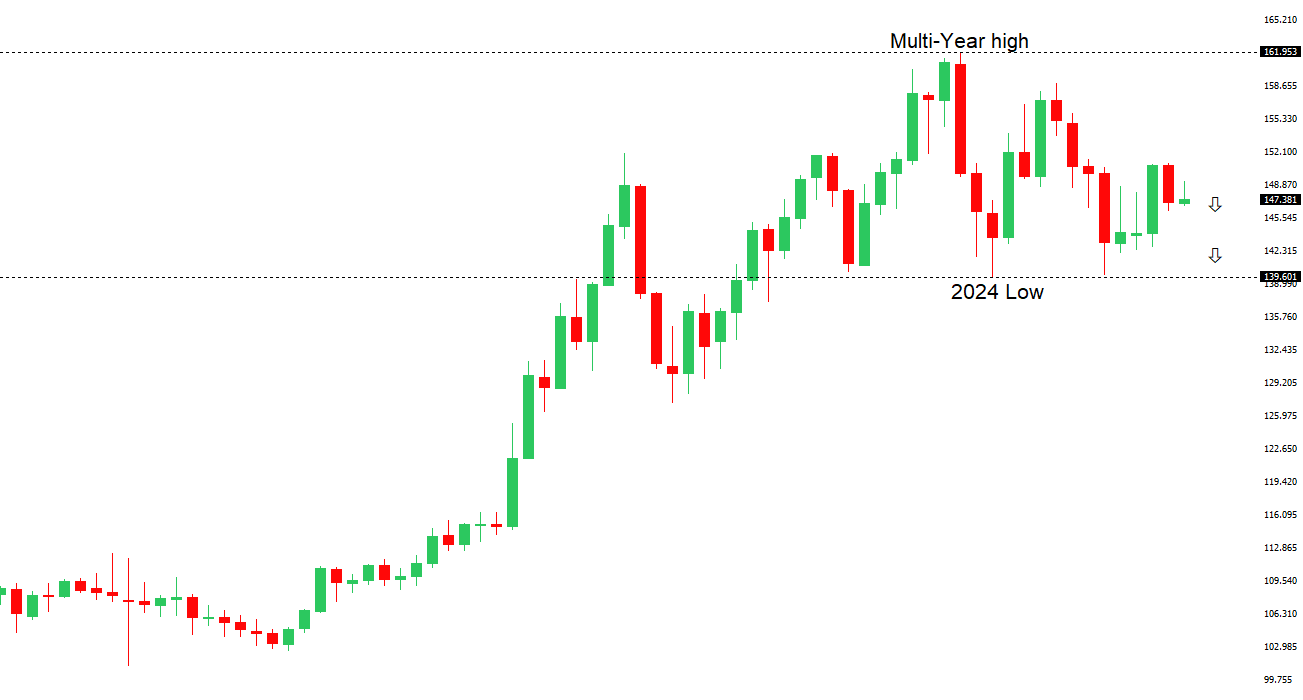 | ||
| R2 150.92 - 1 August high - Strong R1 149.14 - 3 September high - Medium S1 146.21 - 14 August low - Medium S2 145.85 - 24 July low - Strong | ||
| USDJPY: fundamental overview | ||
| Japanese Prime Minister Shigeru Ishiba resigned on Sunday, citing recent election losses and the completion of US trade negotiations, which reduced tariffs on Japanese cars, causing USDJPY to rise and sparking market uncertainty. Japan’s economy grew robustly at 2.2% annualized in Q2 2025, driven by strong domestic demand, though the current account surplus shrank to JPY 2,684.3 billion in July. Potential successors like Sanae Takaichi and Shinjiro Koizumi could influence fiscal and monetary policies, with markets wary of increased bond yields and a weaker yen, while the Nikkei 225 climbed 1.3% amid positive trade developments. | ||
| AUDUSD: technical overview | ||
| There are signs of the potential formation of a longer-term base with the market trading down into a meaningful longer-term support zone. Only a monthly close below 0.5500 would give reason for rethink. A monthly close back above 0.7000 will take the big picture pressure off the downside and strengthen case for a bottom. | ||
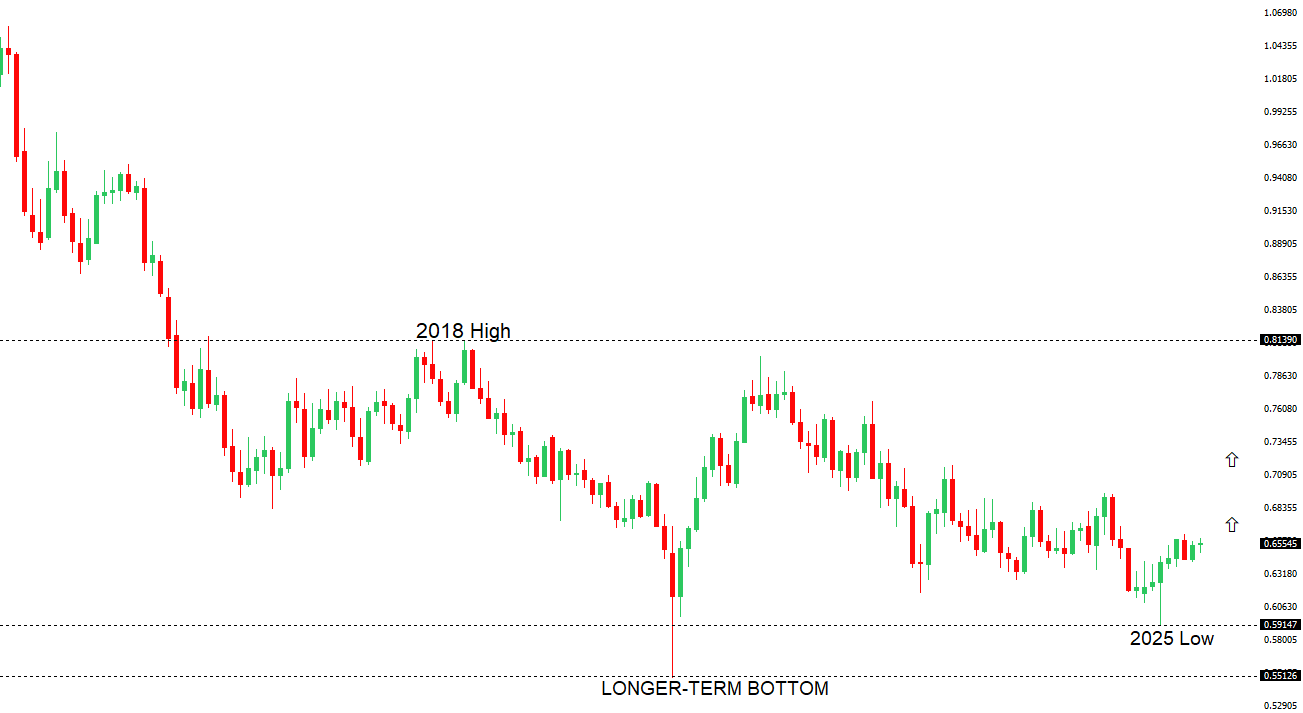 | ||
| R2 0.6600 - Figure - Medium R1 0.6589 - 5 September high - Medium S1 0.6414 - 22 August low - Medium S1 0.6373 - 23 June low - Strong | ||
| AUDUSD: fundamental overview | ||
| The Australian dollar hit a six-week high after a weak US jobs report increased expectations for Federal Reserve rate cuts in September, with markets pricing in a 25-basis-point cut and a possible 50-basis-point reduction. The S&P/ASX 200 gained 0.5%, driven by strong performances in banking and gold stocks, though it recorded a 1.1% weekly loss due to mixed economic signals. Despite robust Australian economic growth and a wider trade surplus, the 10-year bond yield dipped to 4.30%, and the Reserve Bank of Australia may hold off on rate cuts if consumer spending remains strong. | ||
| Suggested reading | ||
| Why Does the Crazy Market Keep Ignoring Bogle’s ‘Iron Rule’?, T. Kim, Barron’s (September 3, 2025) Despite Solid Economic Data, Skepticism Remains, Fisher Investments (September 3, 2025) | ||