


 | ||
| 12th June 2026 | view in browser | ||
| Trading the truce, hedging the uncertainty | ||
| Markets head into the weekend with a cautiously risk-positive tone as hopes for a US-Iran diplomatic breakthrough support equities and weigh on oil and safe havens, though lingering uncertainty around the Strait of Hormuz keeps investors wary of fresh bouts of volatility. | ||
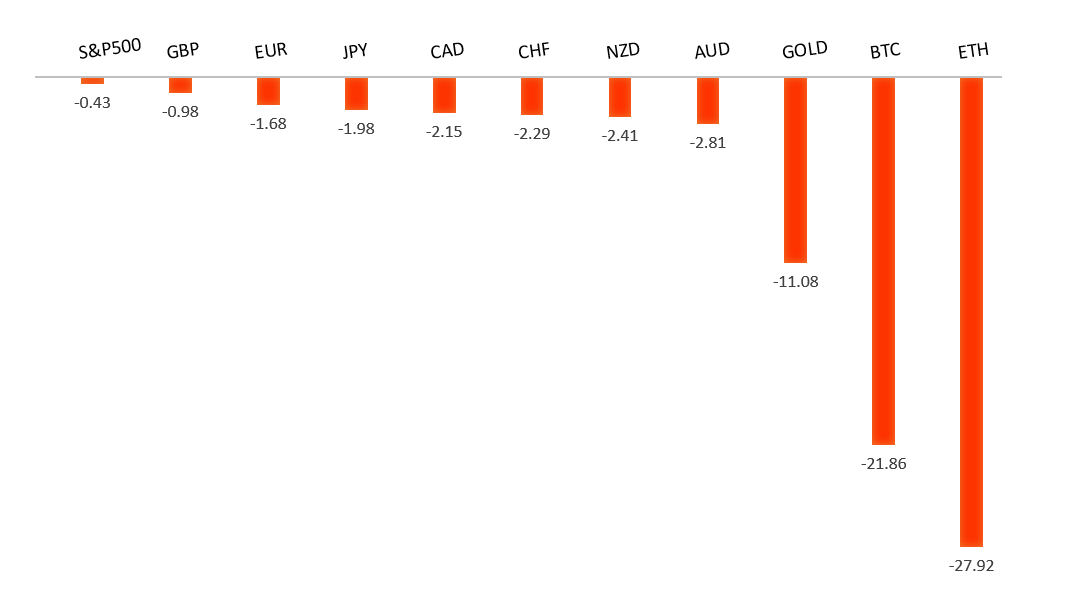
| Performance chart 30day v. USD (%) | ||
 | ||
| Technical & fundamental highlights | ||
| EURUSD: technical overview | ||
| The Euro outlook remains constructive with higher lows sought out on dips in favor of the next major upside extension targeting the 2021 high at 1.2350. Setbacks should be exceptionally well supported ahead of 1.1300. | ||
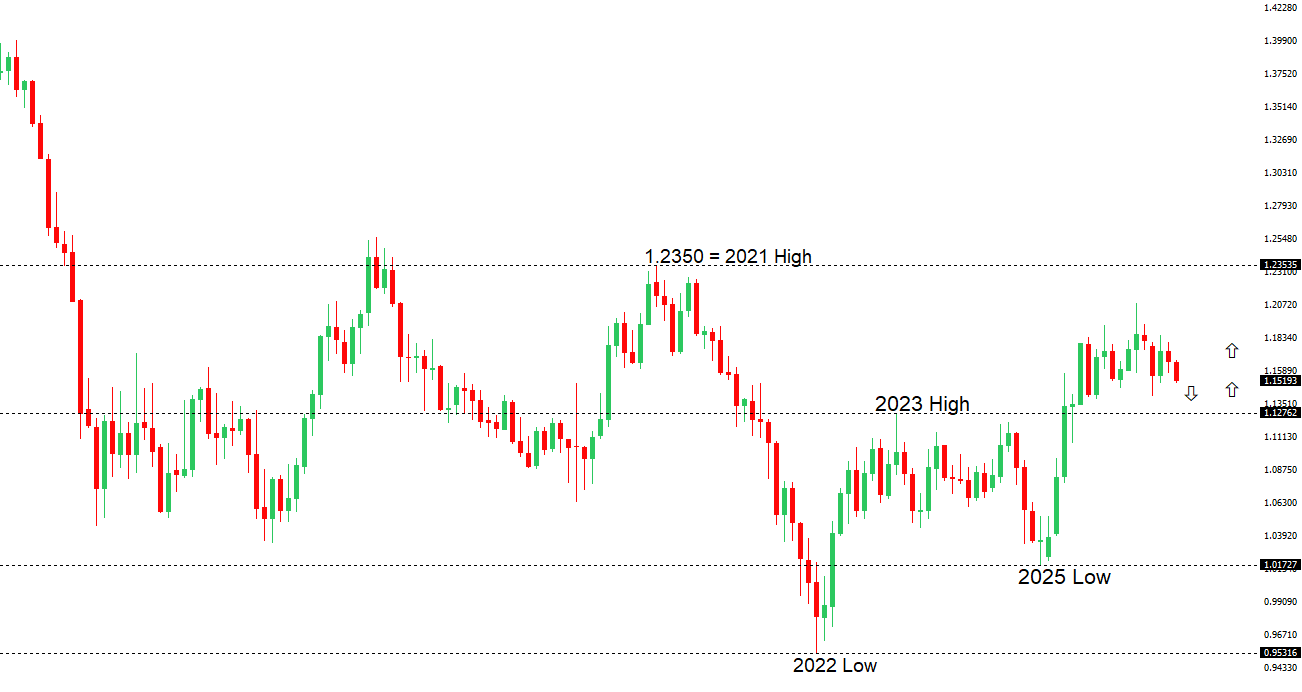 | ||
| R2 1.1646 - 4 June high - Medium R1 1.1590 - 11 June high - Medium S1 1.1500 - 8 June low - Medium S2 1.1443 - 30 March low - Medium | ||
| EURUSD: fundamental overview | ||
| The Euro remains supported by a more hawkish shift in ECB expectations following this week’s rate hike, with policymakers emphasizing that elevated energy prices linked to the Middle East conflict are increasingly feeding through into broader inflation pressures. Markets are now debating whether the move was a one-off adjustment or the beginning of a more sustained tightening cycle, especially after ECB officials including Bundesbank President Nagel stressed that all options remain on the table for July. Recent German inflation data reinforced this view, with core price pressures picking up despite a modest easing in headline inflation, highlighting the risk of persistent second-round effects. At the same time, the common currency has struggled to extend gains against the US Dollar as escalating tensions involving Iran and renewed concerns over disruptions to oil flows through the Strait of Hormuz have boosted safe-haven demand for the Greenback. As a result, EURUSD remains caught between a more resolute ECB determined to prevent inflation expectations from becoming unanchored and a geopolitical backdrop that continues to underpin the USD’s defensive appeal. | ||
| GBPUSD: technical overview | ||
| The Pound remains exceptionally well supported on dips into the 1.3000 area, with the price largely consolidating above the psychological barrier and previous resistance turned support in the form of the 2023 high. Look for the market to continue be well supported on dips ahead of the next major upside extension through the yearly high at 1.3870 and towards a retest of the 2018 high at 1.4377 further up. Only a monthly close below 1.3000 negates. | ||
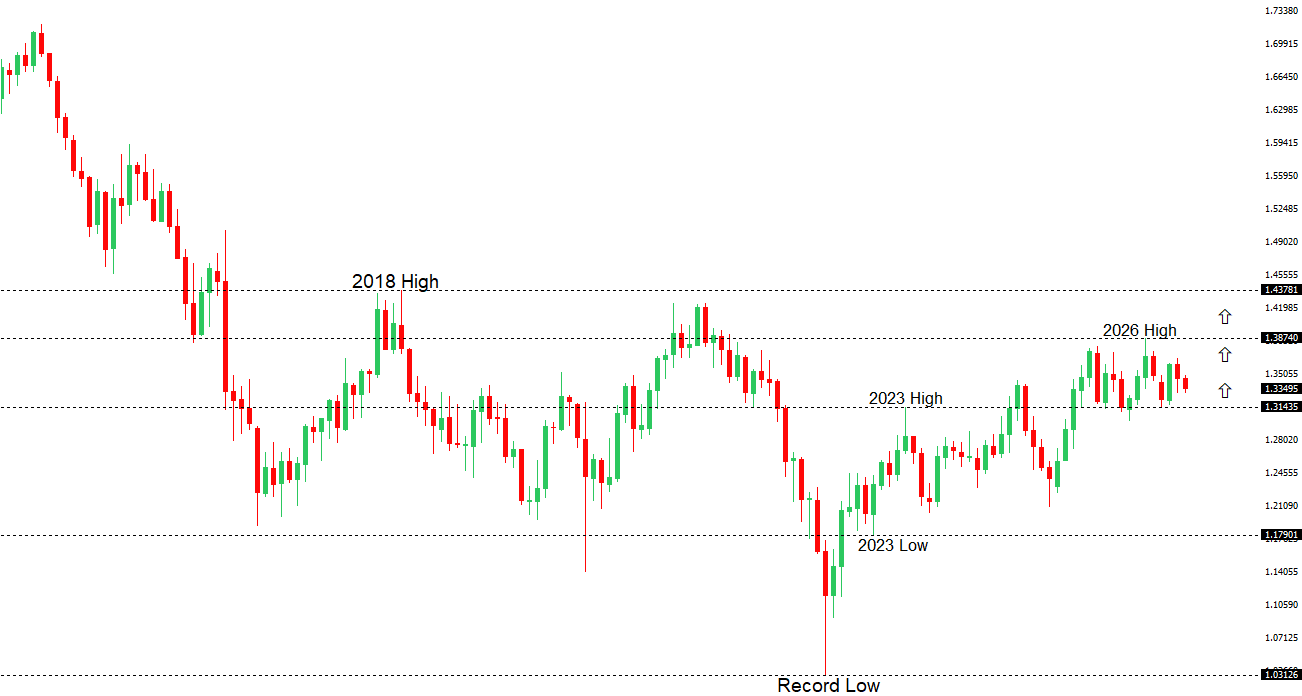 | ||
| R2 1.3509 - 25 May high - Strong R1 1.3434 - 11 June high - Medium S1 1.3302 - 18 May low - Strong S2 1.3219 - 13 March low - Medium | ||
| GBPUSD: fundamental overview | ||
| The Pound is trading with a mildly constructive tone as investors look through a softer set of UK growth figures that largely matched expectations and therefore failed to materially alter the Bank of England outlook. UK GDP contracted by 0.1% in April following a 0.3% expansion in March, reflecting weaker services activity, although manufacturing output surprised to the upside and construction activity remained resilient. More importantly, the broader picture continues to point to an economy that is slowing rather than stalling, with GDP still expanding by 0.7% over the three months to April. Sterling has also found support from the view that persistent inflation pressures could keep the Bank of England cautious about delivering aggressive policy easing. Meanwhile, renewed tensions in the Middle East and concerns about potential disruptions around the Strait of Hormuz have boosted safe-haven demand for the US Dollar, limiting the Pound’s upside rather than triggering a broader selloff. As a result, GBPUSD has remained relatively steady, with markets balancing signs of moderating UK growth against expectations that UK interest rates may stay higher for longer. | ||
| USDJPY: technical overview | ||
| There are signs of the formation of a meaningful top after the market put in a multi-year high in 2024. At this point, rallies should be well capped above 160.00 in favor of a fresh down-leg back towards the 2024 low at 139.58. Only a monthly close above 160.00 negates. | ||
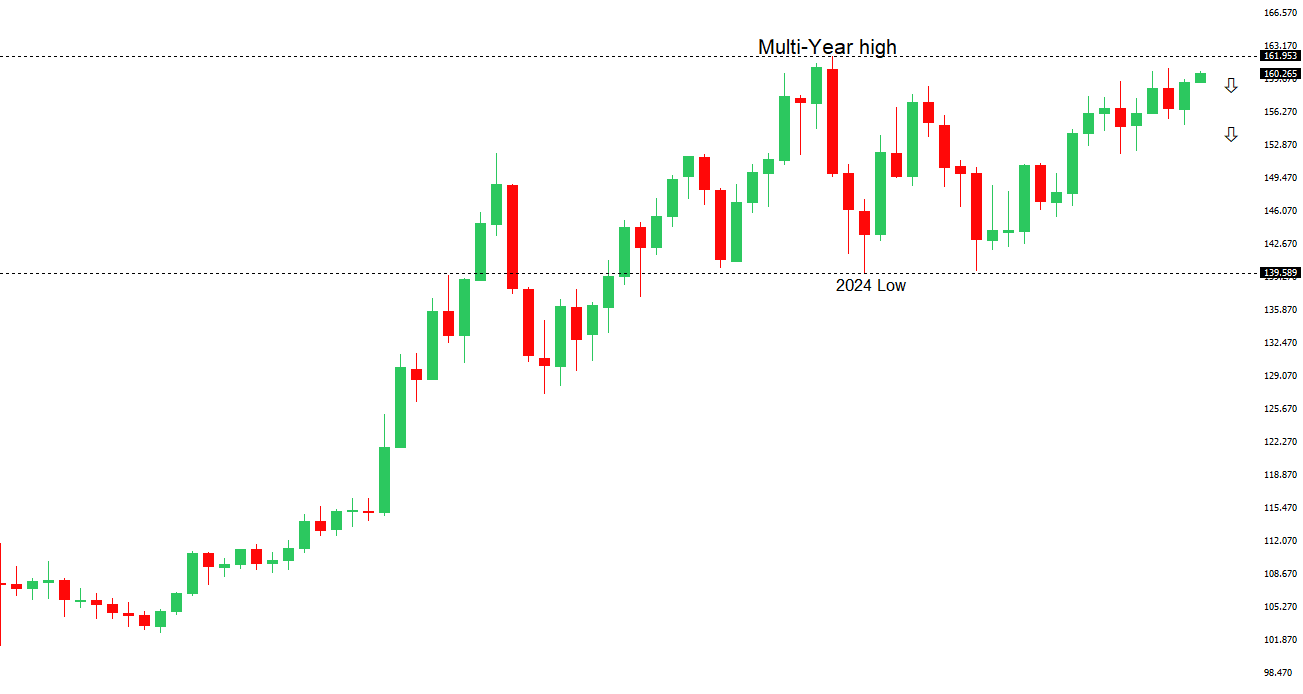 | ||
| R2 160.73 - 30 April/2026 high - Strong R1 160.60 - 11 June high - Strong S1 159.37 - 3 June low - Medium S2 158.59 - 20 May low - Medium | ||
| USDJPY: fundamental overview | ||
| The Yen remains under pressure as escalating tensions between the US and Iran continue to support the safe-haven US Dollar, with investors increasingly concerned about the broader economic implications of prolonged instability in the Middle East. At the same time, USDJPY gains have been tempered by mounting expectations that the Bank of Japan could deliver another rate hike at next week’s policy meeting following stronger-than-expected Japanese producer price data, reinforcing the view that policymakers are becoming more uncomfortable with persistent domestic price pressures and the inflationary effects of a weak currency. Markets are also increasingly alert to the risk of official intervention should USDJPY extend materially beyond the 160 threshold, a level closely associated with previous Japanese authorities’ efforts to stabilize the Yen. Looking ahead, the BoJ meeting and Governor Ueda’s guidance on the pace of further normalization remain key domestic catalysts, while developments in the Middle East and incoming US inflation data will continue to shape expectations around Federal Reserve policy and the broader direction of the pair. | ||
| AUDUSD: technical overview | ||
| There are signs of the formation of a longer-term base with the market recovering out from a meaningful longer-term support zone. The latest monthly close back above 0.7000 takes the big picture pressure off the downside and strengthens the case for a bottom, with the focus now on a push towards 0.8000. Setbacks should now be well supported ahead of 0.6700. | ||
 | ||
| R2 0.7201 - 29 May high - Strong R1 0.7100 - Figure - Medium S1 0.6979 - 11 June low - Medium S2 0.6963 - 8 April low - Strong | ||
| AUDUSD: fundamental overview | ||
| The Australian Dollar is trading on the back foot as renewed geopolitical uncertainty in the Middle East fuels demand for the safe-haven US Dollar, with conflicting signals around a potential US-Iran agreement keeping investors cautious and concerns lingering over the security of the Strait of Hormuz. The Aussie has also been pressured by stronger-than-expected US inflation data and resilient labor market conditions, which have reinforced expectations that the Federal Reserve may need to deliver at least one additional rate hike this year, widening policy divergence risks. Domestically, the focus is shifting to next week’s RBA meeting, where policymakers are widely expected to leave the cash rate unchanged at 4.35% after three consecutive hikes, although the outlook beyond June remains less certain. While stronger Chinese trade data has offered some support given Australia’s close economic ties with China, softer Australian consumer sentiment and signs of slowing domestic demand have tempered optimism. At the same time, market participants continue to debate whether the RBA’s tightening cycle has truly ended, with some economists still seeing scope for additional hikes later this year should inflation prove more persistent than anticipated, leaving the Australian Dollar highly sensitive to incoming inflation, labor market and China-related developments. | ||
| Suggested reading | ||
| Why birth rates are falling everywhere all at once, J. Burn-Murdoch, Financial Times (June 11, 2026) China And The New Joule Order, J. Currie, Carlyle (June 9, 2026) | ||