


 | ||
| 15th June 2026 | view in browser | ||
| Geopolitical risk eases, but markets remain wary | ||
| Markets are starting the week in a risk-on mood as hopes that a U.S.-Iran agreement will lead to the reopening of the Strait of Hormuz weigh on the dollar, lift equities and pressure oil prices, though investors remain cautious ahead of a pivotal week of central bank meetings and amid questions over whether the fragile ceasefire can hold. | ||
| Performance chart 30day v. USD (%) | ||
 | ||
| Technical & fundamental highlights | ||
| EURUSD: technical overview | ||
| The Euro outlook remains constructive with higher lows sought out on dips in favor of the next major upside extension targeting the 2021 high at 1.2350. Setbacks should be exceptionally well supported ahead of 1.1300. | ||
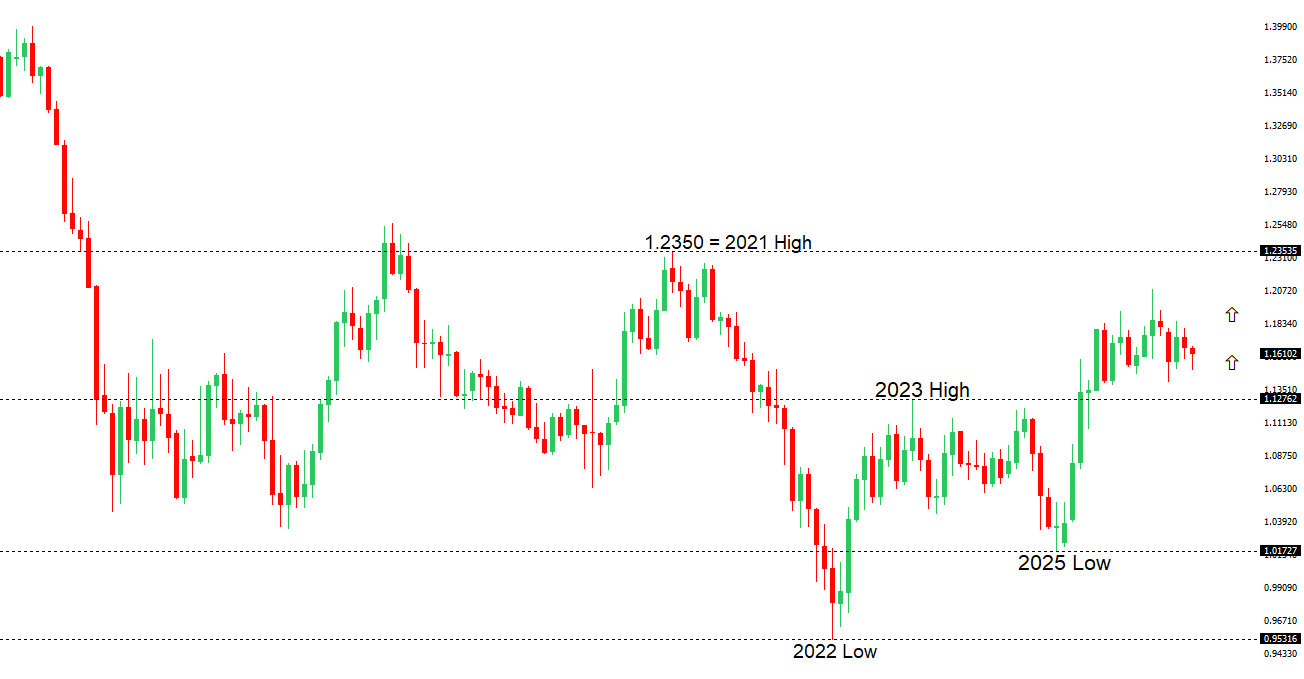 | ||
| R2 1.1686 - 29 May high - Strong R1 1.1646 - 4 June high - Medium S1 1.1557 - 12 June low - Medium S2 1.1500 - 8 June low - Strong | ||
| EURUSD: fundamental overview | ||
| The euro is drawing support from a combination of improving global risk sentiment and a still-hawkish European Central Bank outlook. Reports that the US and Iran have reached a framework agreement to end hostilities and reopen the Strait of Hormuz have weighed on the safe-haven US Dollar, allowing EURUSD to push higher as investors unwind defensive positions. At the same time, the ECB’s recent rate increase – its first in three years – continues to underpin the single currency, with markets increasingly pricing in additional tightening as policymakers remain concerned that elevated energy costs could keep inflation pressures sticky. The central bank’s upgraded inflation forecasts, including higher projections for both headline and core prices through 2027, reinforce the view that rates may need to rise further, with September seen as the most likely timing for another move and July still a possibility. Taken together, fading geopolitical anxiety, a softer Dollar backdrop and expectations that the ECB will maintain a tightening bias are the key fundamental forces currently supporting the euro. | ||
| GBPUSD: technical overview | ||
| The Pound remains exceptionally well supported on dips into the 1.3000 area, with the price largely consolidating above the psychological barrier and previous resistance turned support in the form of the 2023 high. Look for the market to continue be well supported on dips ahead of the next major upside extension through the yearly high at 1.3870 and towards a retest of the 2018 high at 1.4377 further up. Only a monthly close below 1.3000 negates. | ||
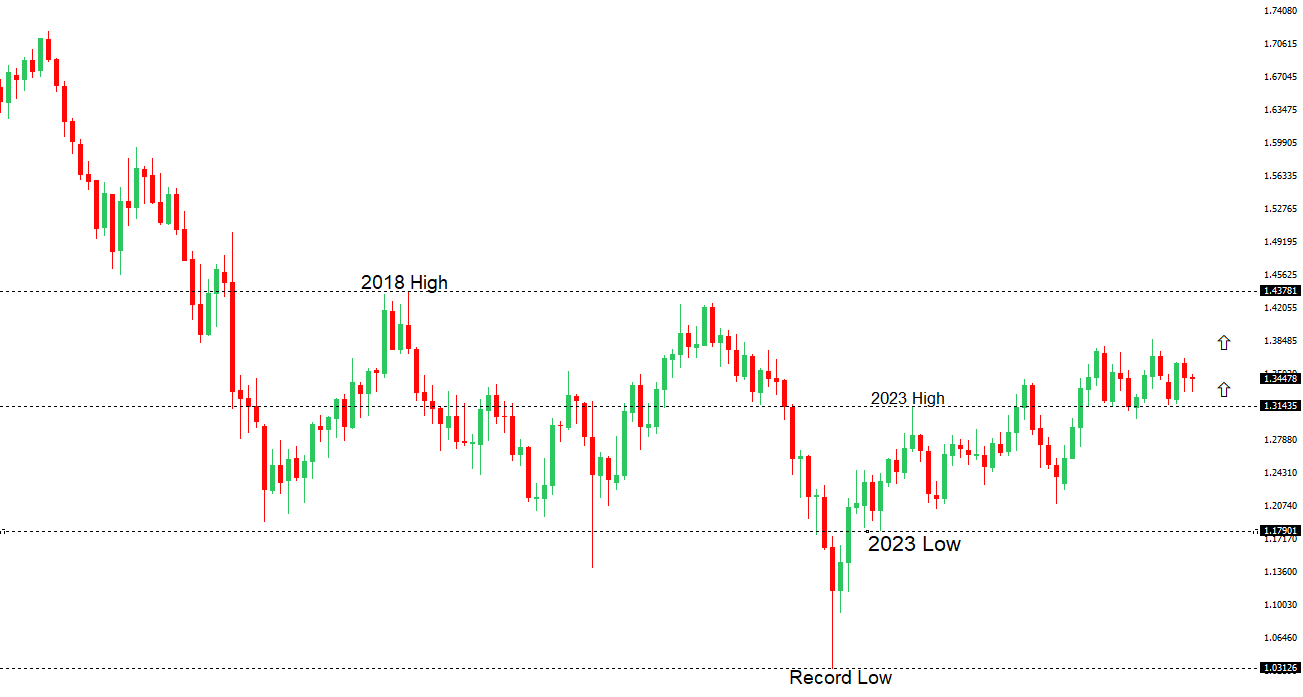 | ||
| R2 1.3509 - 25 May high - Strong R1 1.3486 - 29 May high - Medium S1 1.3383 - 12 June low - Strong S2 1.3302 - 18 May low - Strong | ||
| GBPUSD: fundamental overview | ||
| The Pound continues to draw support from a combination of improving global risk sentiment and the perception that the Bank of England may maintain a relatively restrictive policy stance compared with some of its peers. Sterling has been one of the stronger performers in the G10 space over the past month, underpinned by resilient inflation dynamics and expectations that the BoE will remain cautious about signalling any imminent easing in policy. While the UK economy unexpectedly contracted by 0.1% in April, markets have largely looked through the softer growth print, focusing instead on still-elevated price pressures and a labor market that has yet to show a decisive deterioration. More broadly, reports of a US-Iran peace agreement and the reopening of the Strait of Hormuz have helped lift overall risk appetite and weigh on the US Dollar, providing an additional tailwind for GBPUSD. With the BoE widely expected to keep rates unchanged this week, investors will be paying close attention to incoming inflation and employment data for guidance on how long UK interest rates may need to remain elevated, a backdrop that continues to offer underlying support to the Pound. | ||
| USDJPY: technical overview | ||
| There are signs of the formation of a meaningful top after the market put in a multi-year high in 2024. At this point, rallies should be well capped above 160.00 in favor of a fresh down-leg back towards the 2024 low at 139.58. Only a monthly close above 160.00 negates. | ||
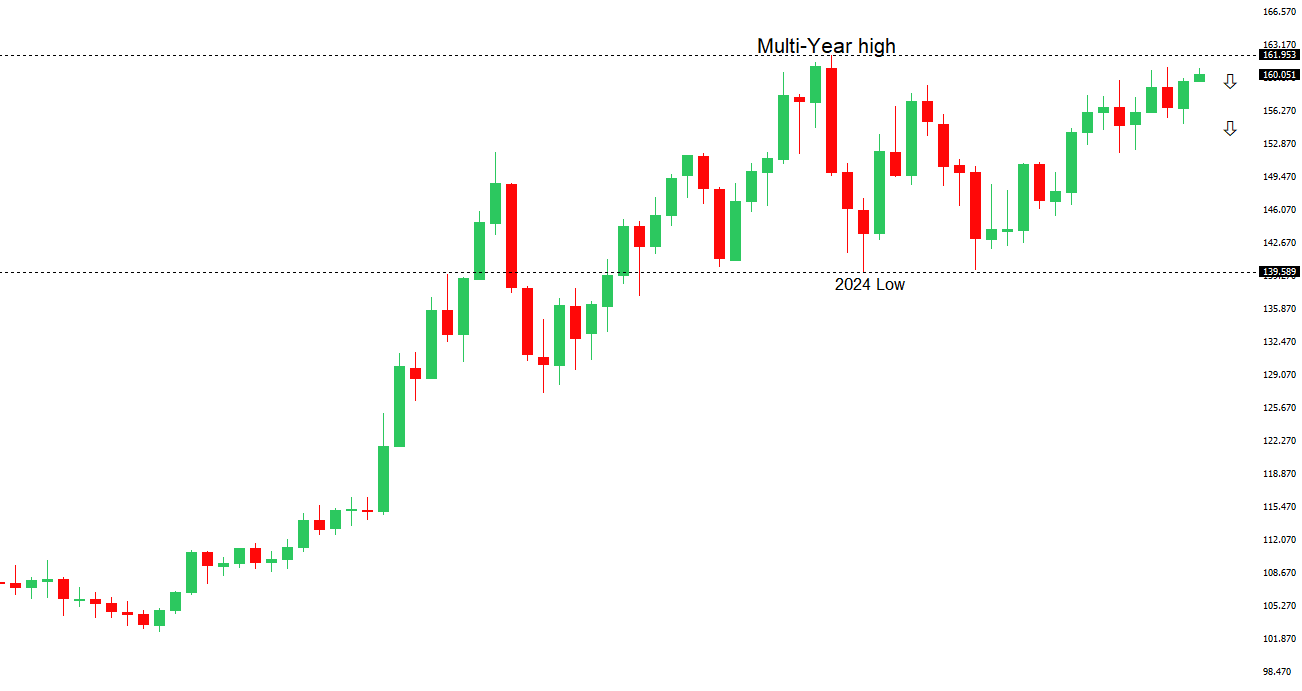 | ||
| R2 160.73 - 30 April/2026 high - Strong R1 160.60 - 11 June high - Strong S1 159.54 - 11 June low - Medium S2 158.59 - 20 May low - Medium | ||
| USDJPY: fundamental overview | ||
| The Yen is trading with a firmer tone as easing geopolitical tensions following reports of a US-Iran peace framework weigh modestly on the US Dollar and support broader risk sentiment. However, the dominant driver for the Yen remains this week’s Bank of Japan policy decision, with markets widely expecting the central bank to deliver another rate hike that would lift rates to their highest level since the mid-1990s. While such a move is largely priced in, investors will be focused on any guidance around the pace of further tightening, particularly amid persistent domestic inflation pressures and concern among policymakers over the inflationary effects of prolonged Yen weakness. At the same time, USDJPY continues to hover near levels that previously triggered official intervention, keeping traders alert to increasingly forceful warnings from Japanese authorities that they stand ready to respond to excessive currency moves. On the US side, the Federal Reserve is expected to leave rates unchanged, with the market looking for clues on the future policy path under Fed Chair Warsh. Ultimately, the near-term direction for the Yen is likely to be dictated by the balance between expectations for a more hawkish BoJ, lingering intervention risks, and whether improving Middle East developments continue to undermine the safe-haven appeal of the US Dollar. | ||
| AUDUSD: technical overview | ||
| There are signs of the formation of a longer-term base with the market recovering out from a meaningful longer-term support zone. The latest monthly close back above 0.7000 takes the big picture pressure off the downside and strengthens the case for a bottom, with the focus now on a push towards 0.8000. Setbacks should now be well supported ahead of 0.6700. | ||
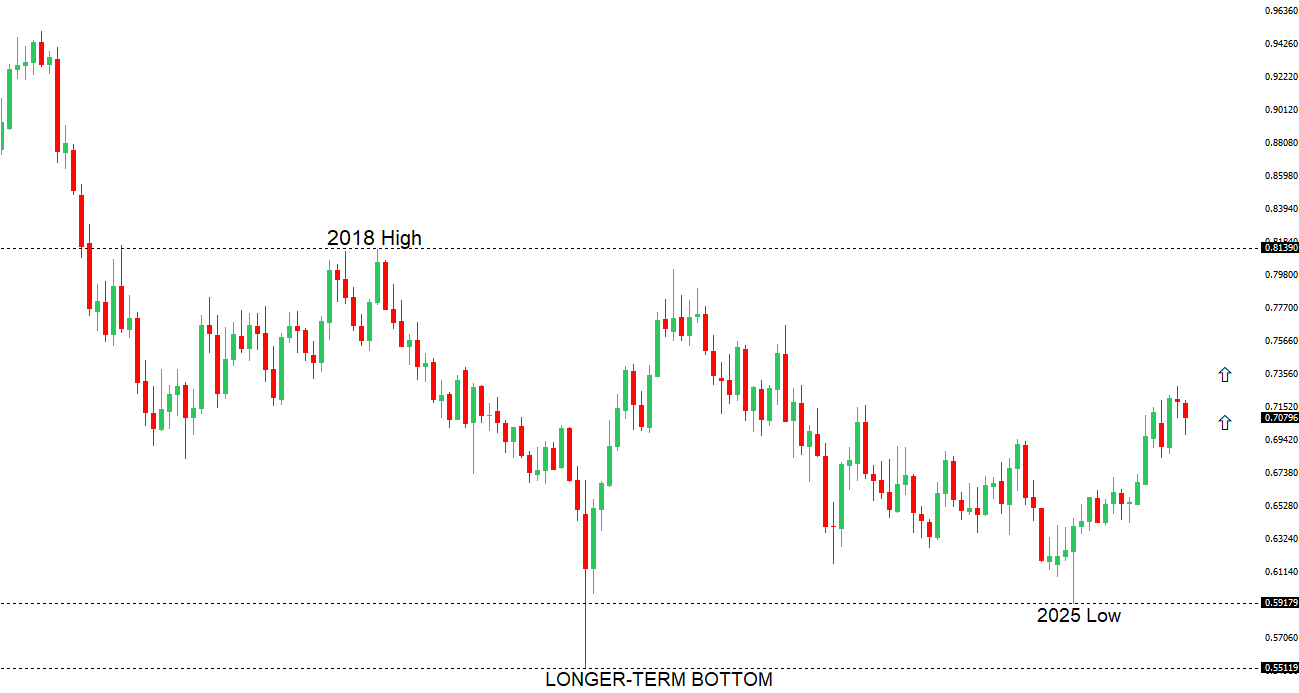 | ||
| R2 0.7201 - 29 May high - Strong R1 0.7100 - Figure - Medium S1 0.6979 - 11 June low - Medium S2 0.6963 - 8 April low - Strong | ||
| AUDUSD: fundamental overview | ||
| The Australian Dollar has found support at the start of the week as an improvement in global risk sentiment weighs on the US Dollar, following reports that the US and Iran have agreed to a peace deal aimed at ending hostilities and reopening the Strait of Hormuz. The easing of geopolitical tensions has helped lift higher-beta currencies such as the Aussie, while also reducing concerns about an energy-driven inflation shock that had previously supported the Greenback. That said, gains in AUDUSD could prove difficult to extend significantly, with the Reserve Bank of Australia widely expected to leave rates unchanged at Tuesday’s policy meeting and markets continuing to pare expectations for any additional tightening in the months ahead. Attention is therefore likely to shift toward the tone of Governor Bullock’s guidance and upcoming Australian inflation data for clues on the policy outlook. Meanwhile, the decline in US Dollar demand has been reinforced by a moderation in Federal Reserve tightening expectations, with market pricing for a December rate hike easing in the aftermath of the Middle East de-escalation. Even so, lingering uncertainty over the durability of the US-Iran agreement and the prospect of renewed geopolitical tensions could continue to generate bouts of volatility and limit the Australian Dollar’s upside potential. | ||
| Suggested reading | ||
| Is Kevin Warsh a Hawk Or a Dove On the Matter of Inflation?, P. Morici, Newsmax (June 12, 2026) If Alive, What Policy Ideas Would Milton Friedman Take Back?, J. Tamny, RCM (June 13, 2026) | ||