


 | ||
| 11th June 2026 | view in browser | ||
| The waiting game: ECB, oil and the Middle East | ||
| Markets are treading cautiously on Thursday as investors balance resilient global fundamentals against escalating Middle East tensions, with oil-driven geopolitical risks and the ECB policy decision shaping a wait-and-see tone across FX, equities, and commodities. | ||
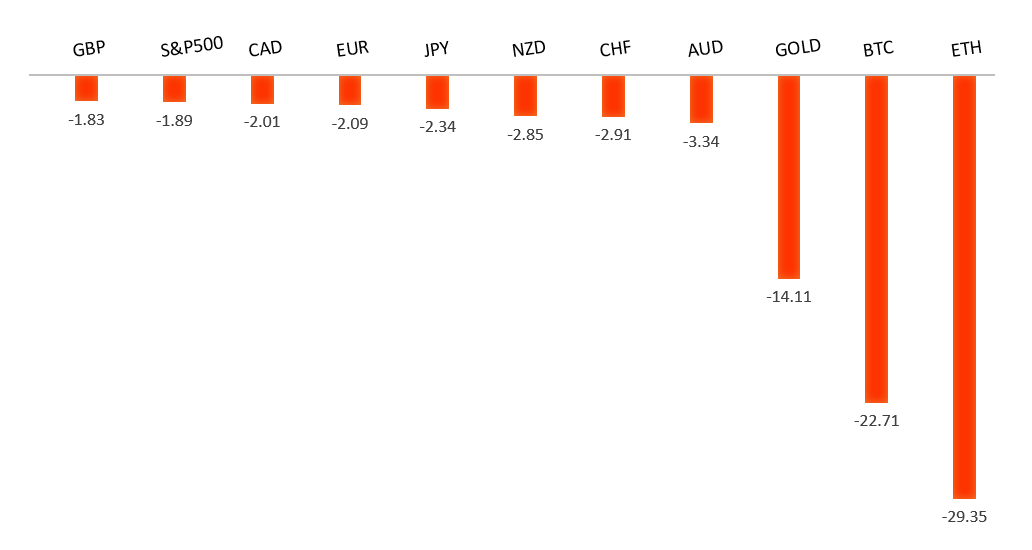
| Performance chart 30day v. USD (%) | ||
 | ||
| Technical & fundamental highlights | ||
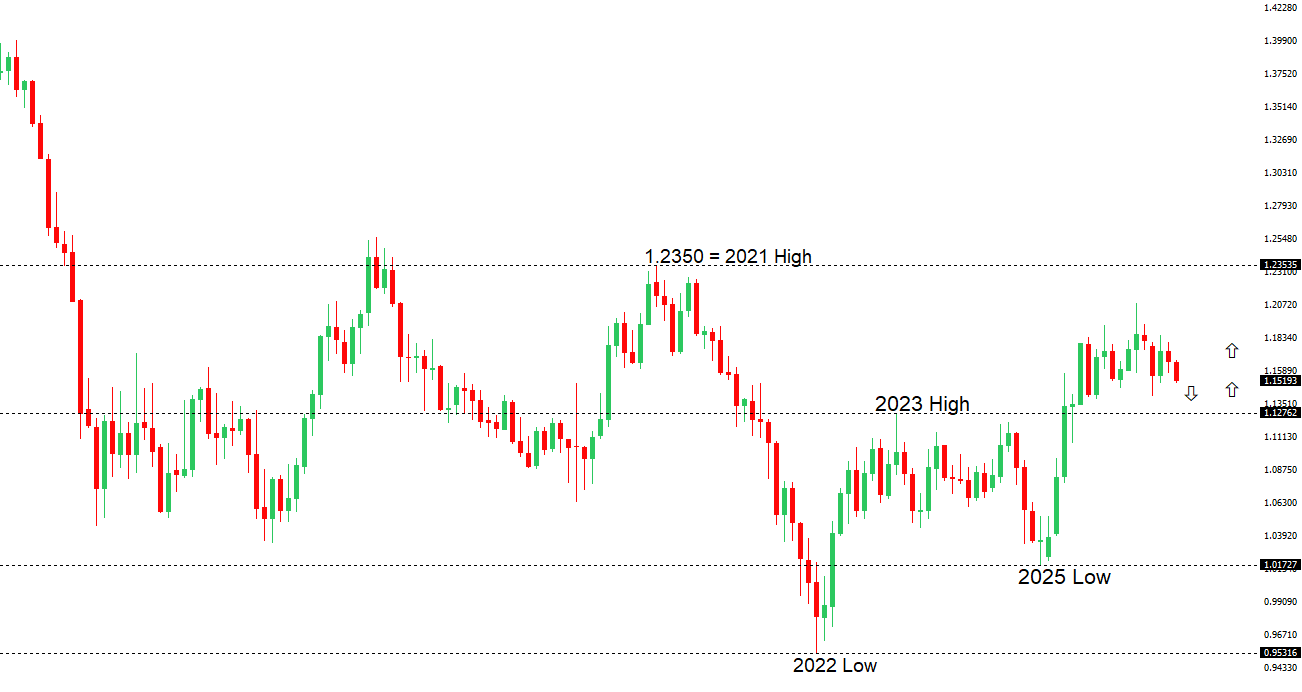
| EURUSD: technical overview | ||
| The Euro outlook remains constructive with higher lows sought out on dips in favor of the next major upside extension targeting the 2021 high at 1.2350. Setbacks should be exceptionally well supported ahead of 1.1300. | ||
 | ||
| R2 1.1646 - 4 June high - Medium R1 1.1576 - 21 May low - Medium S1 1.1500 - 8 June low - Medium S2 1.1443 - 30 March low - Medium | ||
| EURUSD: fundamental overview | ||
| The Euro is finding support ahead of Thursday’s ECB policy decision, with markets widely expecting the central bank to deliver its first rate hike in three years as policymakers seek to prevent elevated energy costs from feeding through into broader inflation pressures. Investors will be focused not only on the rate decision itself, but also on updated staff projections and President Lagarde’s guidance on whether additional tightening remains likely in the months ahead, with markets continuing to price in further rate increases this year. At the same time, gains in the single currency could be tempered by heightened geopolitical uncertainty after fresh US strikes on Iran and threats to shipping through the Strait of Hormuz boosted demand for traditional safe havens, underpinning the US Dollar. As a result, the near-term direction for EURUSD is likely to hinge on the balance between a potentially hawkish ECB message and the extent to which escalating Middle East tensions continue to support the Greenback. | ||
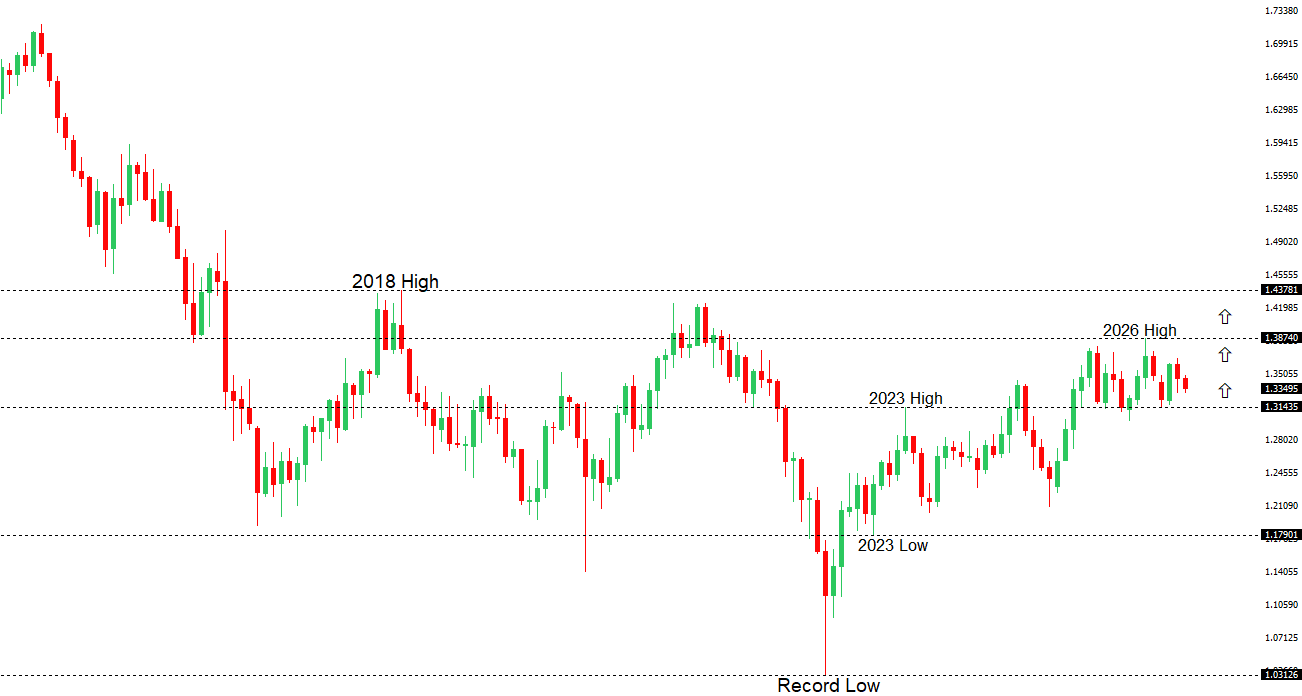
| GBPUSD: technical overview | ||
| The Pound remains exceptionally well supported on dips into the 1.3000 area, with the price largely consolidating above the psychological barrier and previous resistance turned support in the form of the 2023 high. Look for the market to continue be well supported on dips ahead of the next major upside extension through the yearly high at 1.3870 and towards a retest of the 2018 high at 1.4377 further up. Only a monthly close below 1.3000 negates. | ||
 | ||
| R2 1.3509 - 25 May high - Strong R1 1.3424 - 10 June high - Medium S1 1.3302 - 18 May low - Strong S2 1.3219 - 13 March low - Medium | ||
| GBPUSD: fundamental overview | ||
| The Pound remains caught between increasingly hawkish Bank of England expectations and mounting concerns that those rate expectations are being driven by inflationary pressures rather than underlying economic strength. Markets continue to price in the possibility of at least one 25bp BoE rate hike by year-end as elevated energy prices linked to Middle East tensions threaten to push UK inflation higher in the months ahead. However, Sterling’s upside has been constrained by signs of a weakening domestic economy, with unemployment elevated, payroll growth deteriorating and forecasts pointing to softer UK activity data. Political uncertainty has also weighed on sentiment following renewed questions around Prime Minister Starmer’s authority, limiting the Pound’s ability to benefit from rising gilt yields and tighter policy expectations. Externally, developments in the Middle East remain a key driver, with escalating US-Iran tensions supporting safe-haven demand for the US Dollar and acting as a headwind for GBPUSD. At the same time, softer US inflation components have tempered some of the Dollar’s strength, leaving traders focused on upcoming US PPI data and next week’s packed UK calendar featuring CPI, labor market figures and the Bank of England decision, which could prove pivotal in determining Sterling’s near-term direction. | ||
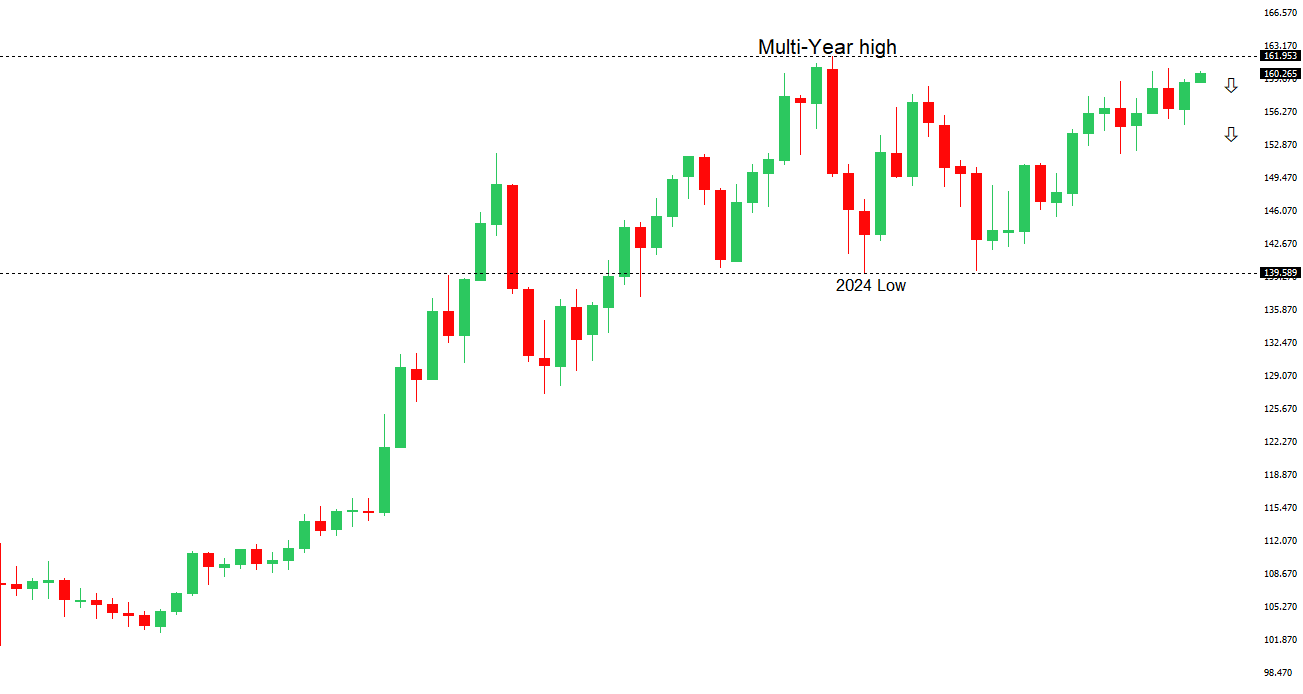
| USDJPY: technical overview | ||
| There are signs of the formation of a meaningful top after the market put in a multi-year high in 2024. At this point, rallies should be well capped above 160.00 in favor of a fresh down-leg back towards the 2024 low at 139.58. Only a monthly close above 160.00 negates. | ||
 | ||
| R2 160.73 - 30 April/2026 high - Strong R1 160.58 - 10 June high - Strong S1 159.37 - 3 June low - Medium S2 158.59 - 20 May low - Medium | ||
| USDJPY: fundamental overview | ||
| The Yen remains under pressure as USDJPY consolidates near the 160.50 area, a level closely associated with Japan’s last major FX intervention, though renewed speculation of official action is helping to limit further upside in the pair. Markets have increasingly priced in a hawkish Bank of Japan outcome next week following a sharp acceleration in Japan’s factory-gate inflation, with expectations now firmly centered around a 25bp rate hike that would lift policy rates to their highest level since the mid-1990s. However, the Yen’s inability to strengthen despite the prospect of tighter policy underscores the continued importance of wide US-Japan yield differentials, particularly after stronger-than-expected US labor market data reinforced expectations that the Federal Reserve will keep rates elevated for longer. At the same time, escalating tensions in the Middle East, including renewed US strikes on Iranian targets and Tehran’s threats of further retaliation, have supported broader safe-haven demand for the US Dollar. Investors are now focused on upcoming US inflation data and next week’s BoJ decision, with any upside surprises in US prices likely to push USDJPY deeper into intervention territory and intensify scrutiny over Tokyo’s willingness to step into the market once again. | ||
| AUDUSD: technical overview | ||
| There are signs of the formation of a longer-term base with the market recovering out from a meaningful longer-term support zone. The latest monthly close back above 0.7000 takes the big picture pressure off the downside and strengthens the case for a bottom, with the focus now on a push towards 0.8000. Setbacks should now be well supported ahead of 0.6700. | ||
 | ||
| R2 0.7201 - 29 May high - Strong R1 0.7100 - Figure - Medium S1 0.6987 - 11 June low - Medium S2 0.6963 - 8 April low - Strong | ||
| AUDUSD: fundamental overview | ||
| The Australian Dollar is attempting to stabilize back above the 0.7000 handle, drawing support from a softer US Dollar after the latest US inflation data eased concerns about an immediate acceleration in underlying price pressures and prompted investors to trim aggressive Fed expectations. However, the Australian Dollar’s upside remains constrained by a more cautious outlook for the Reserve Bank of Australia, with markets continuing to scale back expectations for additional RBA tightening following softer domestic data. At the same time, escalating geopolitical tensions in the Middle East, including fresh US strikes on Iran and Tehran’s threats to disrupt shipping through the Strait of Hormuz, have kept energy markets on edge and revived concerns that higher oil prices could prolong global inflation pressures. Stronger Chinese producer price data, meanwhile, has reinforced the view that upstream price pressures are building across the region, although lingering uncertainty around China’s broader growth outlook continues to temper enthusiasm toward the China-sensitive Aussie. Looking ahead, traders remain focused on incoming US data, particularly the PPI release, for clues on the Fed’s policy path, while the balance between fading RBA tightening expectations and swings in global risk sentiment is likely to remain the dominant driver for the Australian Dollar in the near term. | ||
| Suggested reading | ||
| There Will Be No Fed Rate Cuts Anytime Soon, D. Lachman, AEIdeas (June 9, 2026) The Best Place To Hide Needles Is In A Haystack, B. Arends, Marketwatch (June 10, 2026) | ||