


 | ||
| 30th April 2025 | view in browser | ||
| Will a heavy batch of data move markets? | ||
| Treasury Secretary Bessent’s mention of an “escalation ladder” and potential embargo seems to have been interpreted by China as a threat after it prompted the Chinese Foreign Minister to warn against yielding to U.S. tariffs. | ||
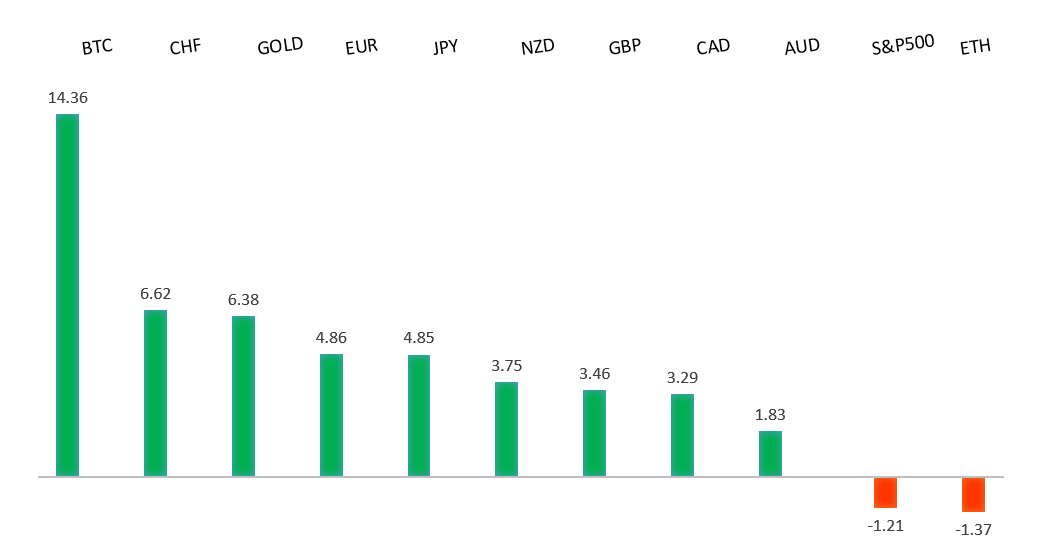
| Performance chart 30day v. USD (%) | ||
 | ||
| Technical & fundamental highlights | ||
| EURUSD: technical overview | ||
| The Euro has finally broken out from a multi-month consolidation off a critical longer-term low. This latest push through the 2023 high lends further support to the case for a meaningful bottom, setting the stage for a bullish structural shift and the next major upside extension targeting the 2021 high at 1.2350. Setbacks should be exceptionally well supported below 1.1000. | ||
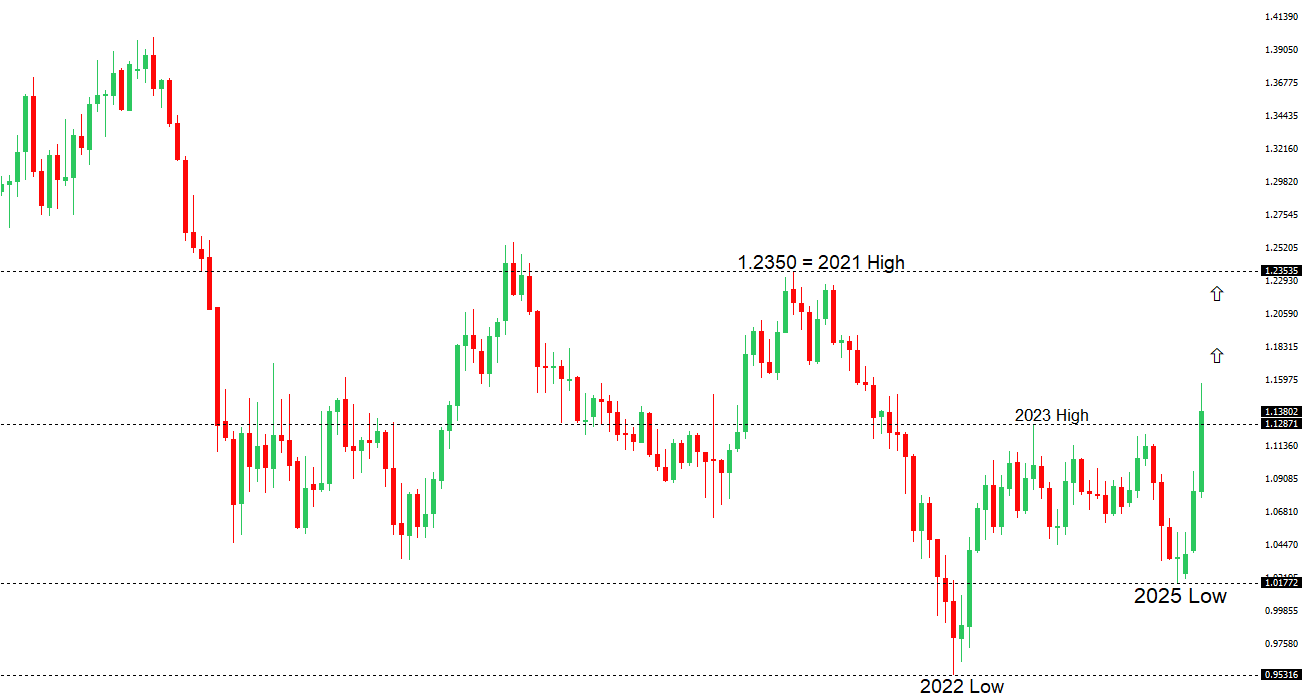 | ||
| R1 1.1574 - 21 April/2025 high - Strong R1 1.1440 - 23 April high - Medium S1 1.1308 - 23 April low - Medium S2 1.1264 - 15 April low - Strong | ||
| EURUSD: fundamental overview | ||
| Inflation expectations in the Eurozone rose, with March Consumer CPI forecasts over 1-year and 3-year periods reaching 2.9% (up from 2.6%) and 2.5%, respectively, surpassing the ECB’s 2% target in the short term, while the new 5-year CPI expectation of 2.1% remains more stable. Despite the ECB lowering its 2025 GDP forecast to 0.9% from 1.1% and April Economic Confidence dropping to 93.6, markets expect the ECB to prioritize growth over inflation risks, pricing in a June rate cut and potentially two more, with deposit rates possibly bottoming at 1.75%-1.50%. In Germany, the May Gfk Consumer Confidence Survey improved to -20.6 from -24.5, buoyed by a stable new government and fiscal policies, despite U.S. tariffs on German goods and a gloomy IMF outlook. Franklin Templeton is out predicting the ECB might shift toward rate hikes by year-end as Europe recovers in 2025, driven by defense and infrastructure spending, potentially reigniting inflation, while banks like JPMorgan Chase, BNP Paribas, and Danske Bank forecast a stronger Euro at 1.20 or higher against the Dollar by year-end, complicating export-driven recoveries in nations like Germany amid faltering Russia-Ukraine peace talks. | ||
| USDJPY: technical overview | ||
| There are signs of a meaningful top in place after the market put in a multi-year high in 2024. At this point, the door is now open for a deeper setback below the 2024 low at 139.58 over the coming sessions exposing a retest of the 2023 low. Rallies should be well capped below 150.00. | ||
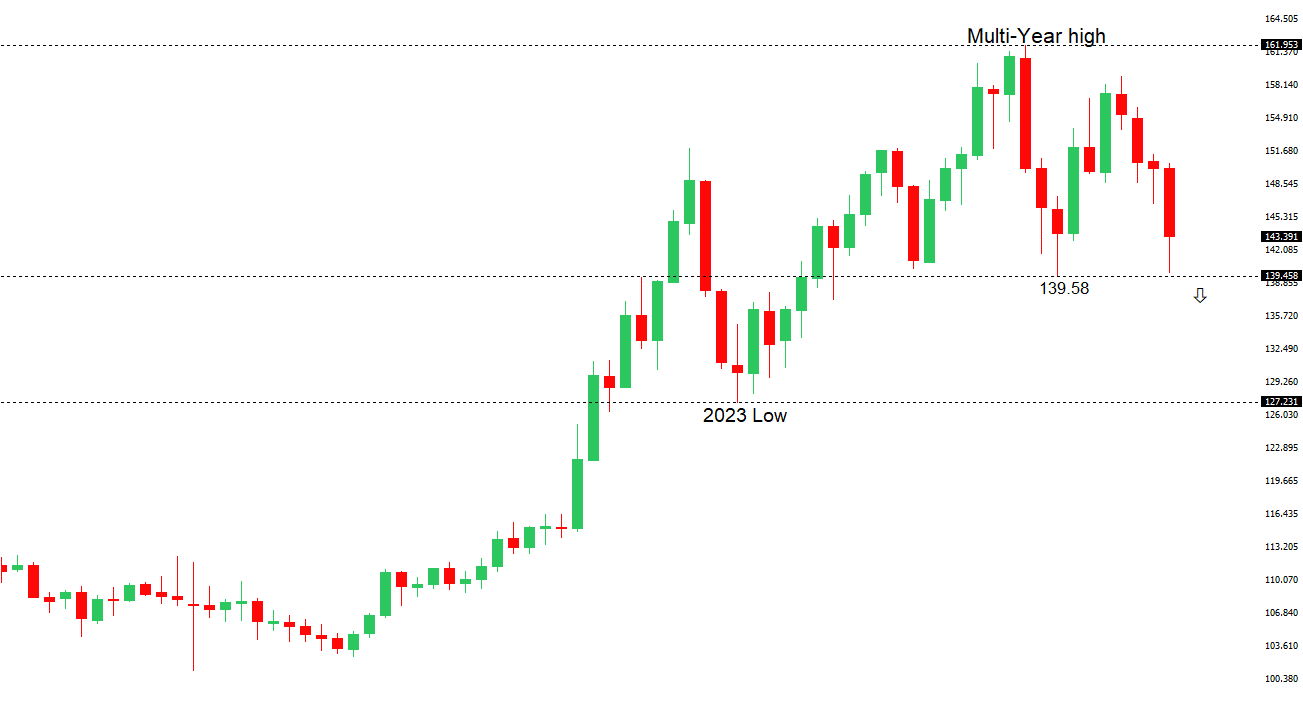 | ||
| R2 144.58 - 11 April high - Medium R1 144.04 - 25 April high - Medium S1 141.45 - 23 April low - Medium S1 139.89 - 22 April/2025 low - Strong | ||
| USDJPY: fundamental overview | ||
| Speculators remain heavily bullish on the Yen, with CFTC data showing net long positions at 177,814 contracts as of April 22, though overbought indicators suggest caution. The BOJ is expected to hold its policy rate at 0.5% at the April 30-May 1 meeting amid trade war uncertainties, but rising Tokyo CPI (3.5% headline, 3.4% core) signals persistent inflation, potentially prompting rate hikes in the second half of the year as trade clarity emerges. Japan’s economic data shows mixed signals: March industrial production fell 1.1% MoM, reflecting tariff-related manufacturing slowdowns, while retail sales grew 3.1% YoY, marking 36 months of expansion, though a 1.2% MoM drop hints at slowing momentum. The BOJ is likely to lower its growth forecast but maintain its gradual rate-hike stance, supported by a Bloomberg survey showing no immediate policy change, with expectations for a terminal rate now at 1% and a possible hike by September. | ||
| AUDUSD: technical overview | ||
| There are signs of the potential formation of a longer-term base with the market trading down into a meaningful longer-term support zone. Only a monthly close below 0.5500 would give reason for rethink. A monthly close back above 0.7000 will take the big picture pressure off the downside and strengthen case for a bottom. | ||
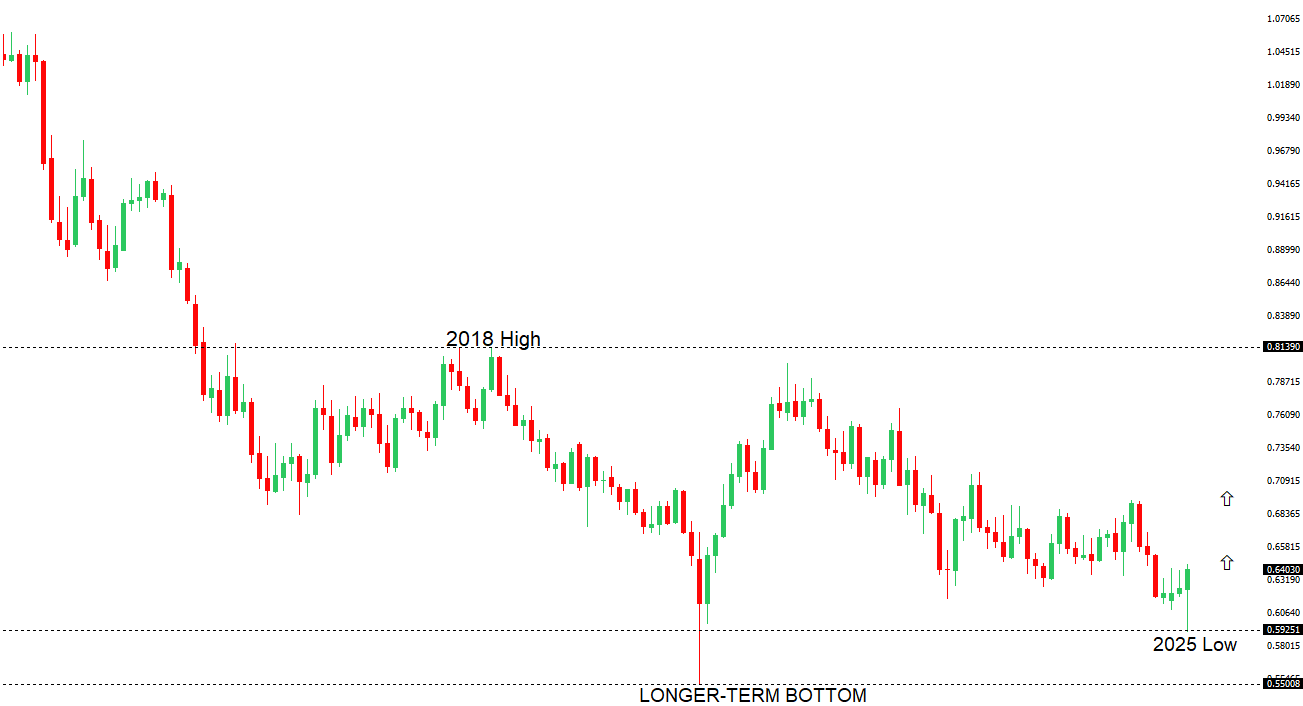 | ||
| R2 0.6500 - Psychological - Strong R1 0.6450 - 29 April/2025 high - Medium S1 0.6344 - 24 April low - Medium S1 0.6275 - 14 April low - Strong | ||
| AUDUSD: fundamental overview | ||
| The Australian Dollar has been showing signs of wanting to bottom out, driven by a shift away from US Dollar assets and China’s signaling of accelerated fiscal and monetary stimulus, including faster government bond issuance, potential rate cuts, and relaxed market restrictions, which should support Aussie as a CNY proxy. However, disappointing U.S. data, the ongoing U.S.-China trade tensions, and weak Chinese Manufacturing PMI figures may temper bullish momentum, potentially stalling AUDUSD below the 200-day moving average. In Australia, March inflation held steady at 2.4%, slightly above the expected 2.2%, but markets still anticipate an RBA rate cut in May, prioritizing economic growth over inflation concerns, as CPI remains below the RBA’s 2%-3% target midpoint. Meanwhile, S&P Global Ratings cautioned that Australia’s AAA credit rating could be at risk if election pledges lead to larger deficits, though polls favor a Centre-Left Labor government win on May 3, influenced by global anti-conservative sentiment tied to the “Trump effect.” | ||
| Suggested reading | ||
| Hopping from tariffs to data, F. Pesole, ING (April 29, 2025) A Generational Change?, J. Calhoun, Alhambra Investments (April 27, 2025) | ||