


 | ||
| 1st May 2025 | view in browser | ||
| Yen declines after BOJ delays inflation target | ||
| In Asia-Pacific markets, focus centered on the BOJ’s May monetary policy decision amid holidays like Labour Day and Japan’s Golden Week, with the BOJ maintaining rates but delaying its 2% inflation target forecast, reducing expectations for near-term rate hikes and opening downside pressure on the yen. | ||
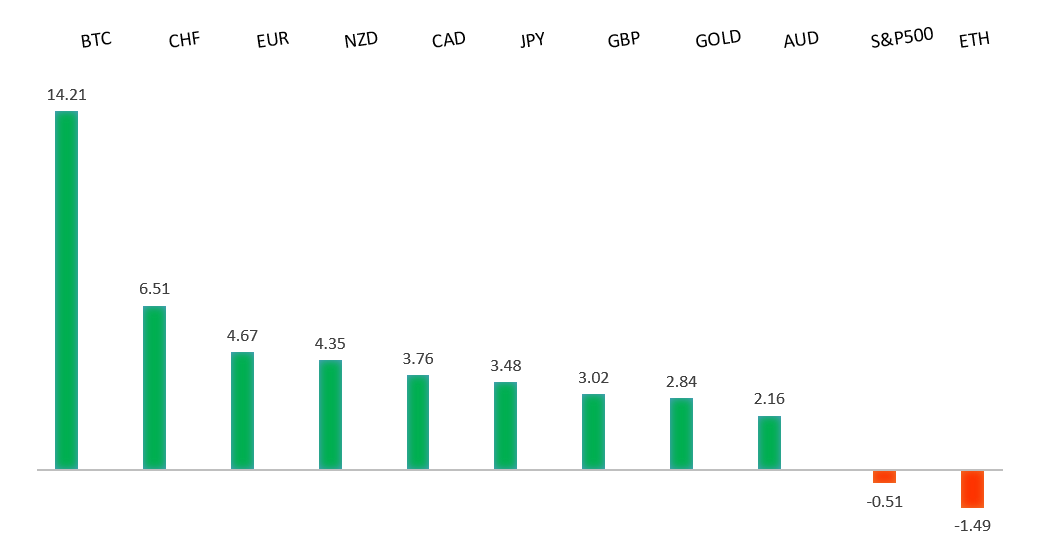
| Performance chart 30day v. USD (%) | ||
 | ||
| Technical & fundamental highlights | ||
| EURUSD: technical overview | ||
| The Euro has finally broken out from a multi-month consolidation off a critical longer-term low. This latest push through the 2023 high lends further support to the case for a meaningful bottom, setting the stage for a bullish structural shift and the next major upside extension targeting the 2021 high at 1.2350. Setbacks should be exceptionally well supported below 1.1000. | ||
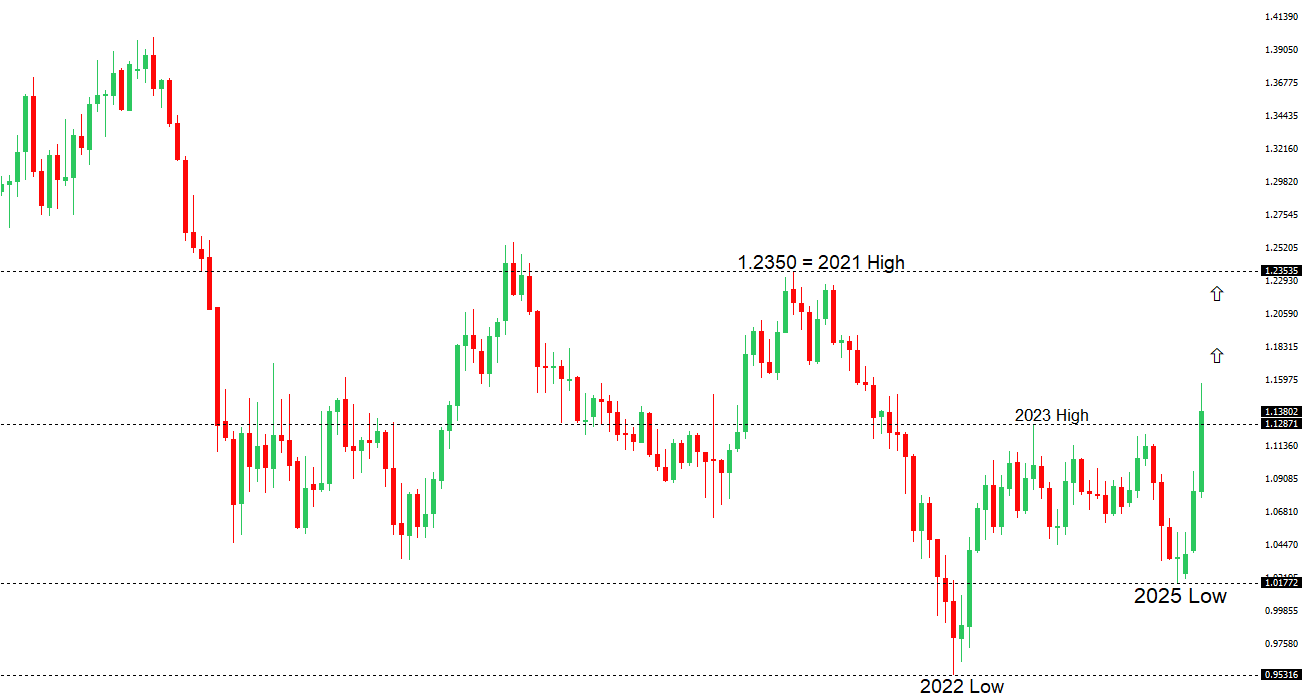 | ||
| R1 1.1574 - 21 April/2025 high - Strong R1 1.1440 - 23 April high - Medium S1 1.1300 - Figure - Medium S2 1.1264 - 15 April low - Strong | ||
| EURUSD: fundamental overview | ||
| ECB’s Makhlouf stated on Wednesday that the long-term effects of U.S. tariffs and potential countermeasures on the euro-area are uncertain, but they pose a near-term negative impact on the region’s economic outlook and a downside risk to inflation. He noted that trade flow diversions, particularly from China and the EU, could influence inflation pressures. Additionally, Makhlouf confirmed the ECB will continue its meeting-by-meeting approach to monetary policy decisions. | ||
| USDJPY: technical overview | ||
| There are signs of a meaningful top in place after the market put in a multi-year high in 2024. At this point, the door is now open for a deeper setback below the 2024 low at 139.58 over the coming sessions exposing a retest of the 2023 low. Rallies should be well capped below 150.00. | ||
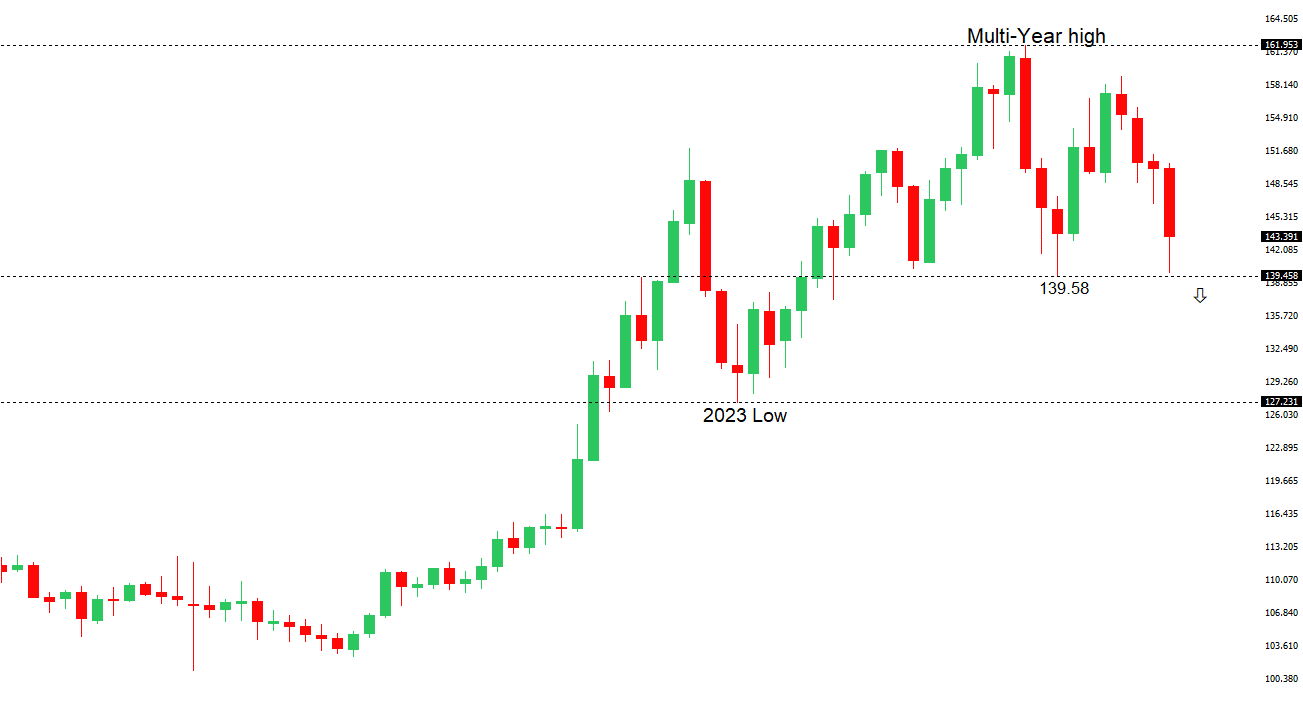 | ||
| R2 144.58 - 11 April high - Medium R1 144.04 - 25 April high - Medium S1 141.45 - 23 April low - Medium S1 139.89 - 22 April/2025 low - Strong | ||
| USDJPY: fundamental overview | ||
| The Bank of Japan held steady on rates as widely expected, but delayed the 2% inflation target due to increased external uncertainties. Clearly this is having an impact on price action, with the yen under pressure in the aftermath. Other data highlighted includes manufacturing PMIs showing an ongoing contraction, with declining orders and exports, leading to reduced purchasing and inventory adjustments. Meanwhile, business confidence is at its lowest since the mid-2020s due to global trade and demand concerns. Recovery hinges on stronger domestic and international demand. | ||
| AUDUSD: technical overview | ||
| There are signs of the potential formation of a longer-term base with the market trading down into a meaningful longer-term support zone. Only a monthly close below 0.5500 would give reason for rethink. A monthly close back above 0.7000 will take the big picture pressure off the downside and strengthen case for a bottom. | ||
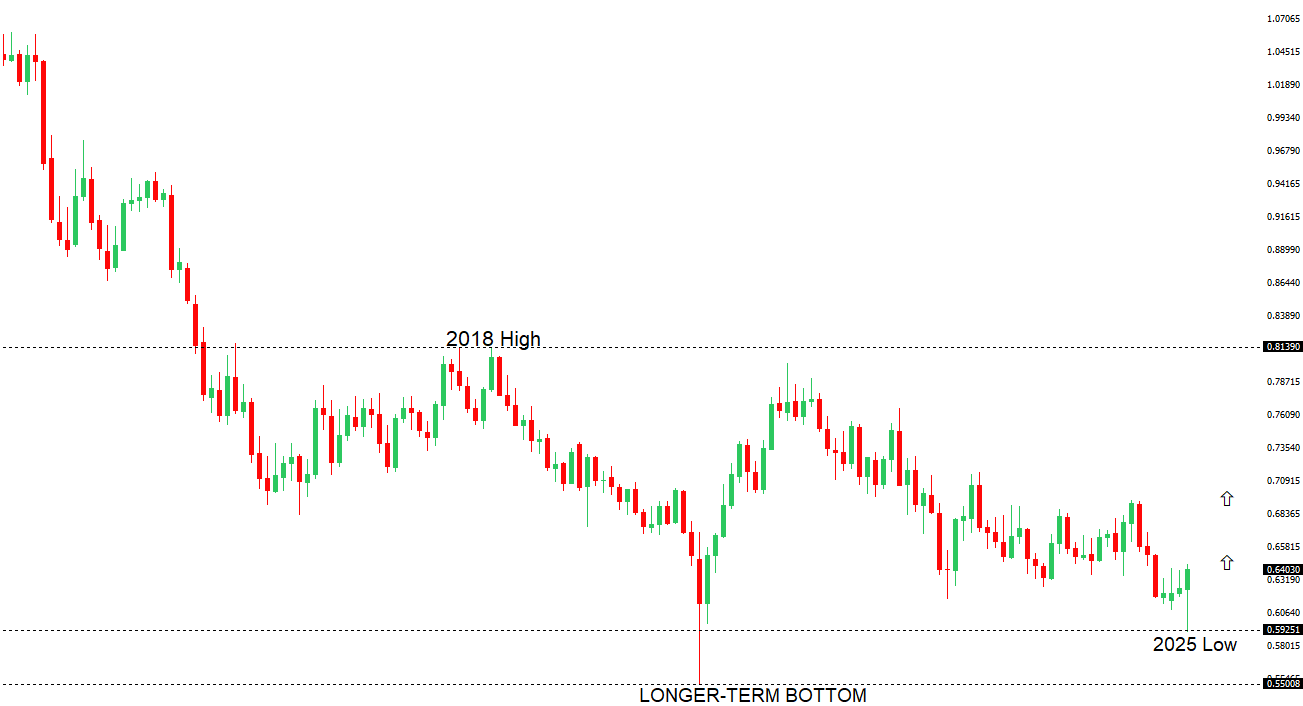 | ||
| R2 0.6500 - Psychological - Strong R1 0.6450 - 29 April/2025 high - Medium S1 0.6344 - 24 April low - Medium S1 0.6275 - 14 April low - Strong | ||
| AUDUSD: fundamental overview | ||
| The STIR market anticipates steady RBA rate cuts in 2025, pricing in a 27bp reduction for the May 20 meeting—fully expecting a 25bp cut—and a total of 112bp by year-end, suggesting a possible fifth cut, though this seems optimistic given uncertainties around tariffs and inflation. Australian trade data for March revealed a larger-than-expected surplus of A$6,900 million, driven by a 7.6% rise in exports, particularly non-monetary gold (+25.9%) and general merchandise (+5.6%), while imports fell 2.2%. Q1 terms of trade showed rising export and import prices, boosted by a weaker Aussie dollar, with export prices up 2.1% due to gains in metalliferous ores (+5.4%) and gold (+12.4%), fueled by Chinese growth optimism and global uncertainty. | ||
| Suggested reading | ||
| Why Berkshire Hathaway’s Stock is Beating the Market in 2025, A. Arnott, Morningstar (April 30, 2025) Small boost to German growth fails to quell recession risk, C. Brzeski, ING (April 30, 2025) | ||