


 | ||
| 2nd May 2025 | view in browser | ||
| Trade talks and tariffs: markets brace for shift | ||
| The “Sell America” and peak AI investment themes, once overhyped, are now correcting, with markets entering a consolidation phase as the Trump administration softens its stance on tariffs and seeks trade deals, particularly with China, which insists on tariff removal before talks. | ||
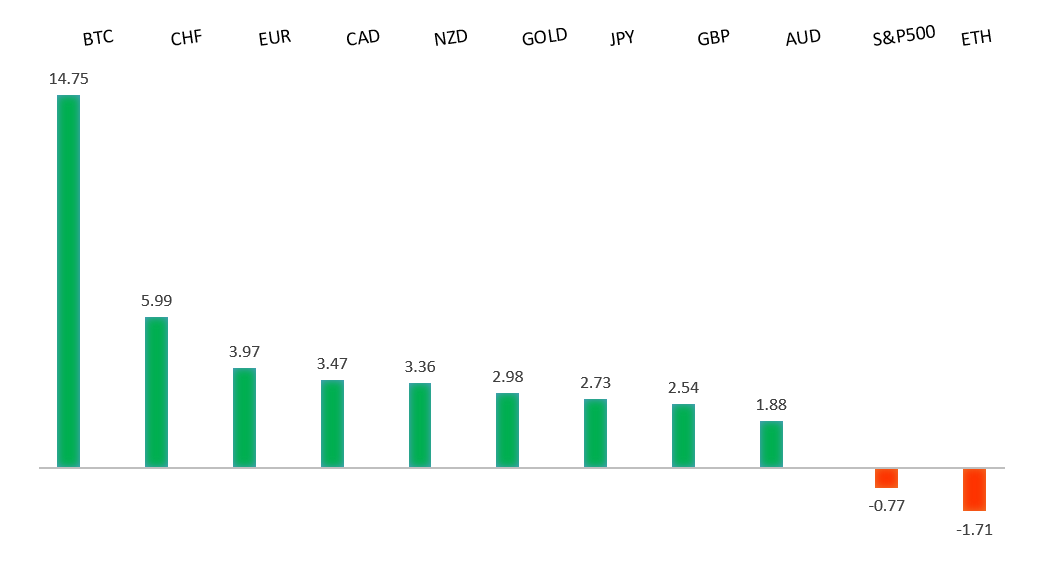
| Performance chart 30day v. USD (%) | ||
 | ||
| Technical & fundamental highlights | ||
| EURUSD: technical overview | ||
| The Euro has finally broken out from a multi-month consolidation off a critical longer-term low. This latest push through the 2023 high lends further support to the case for a meaningful bottom, setting the stage for a bullish structural shift and the next major upside extension targeting the 2021 high at 1.2350. Setbacks should be exceptionally well supported below 1.1000. | ||
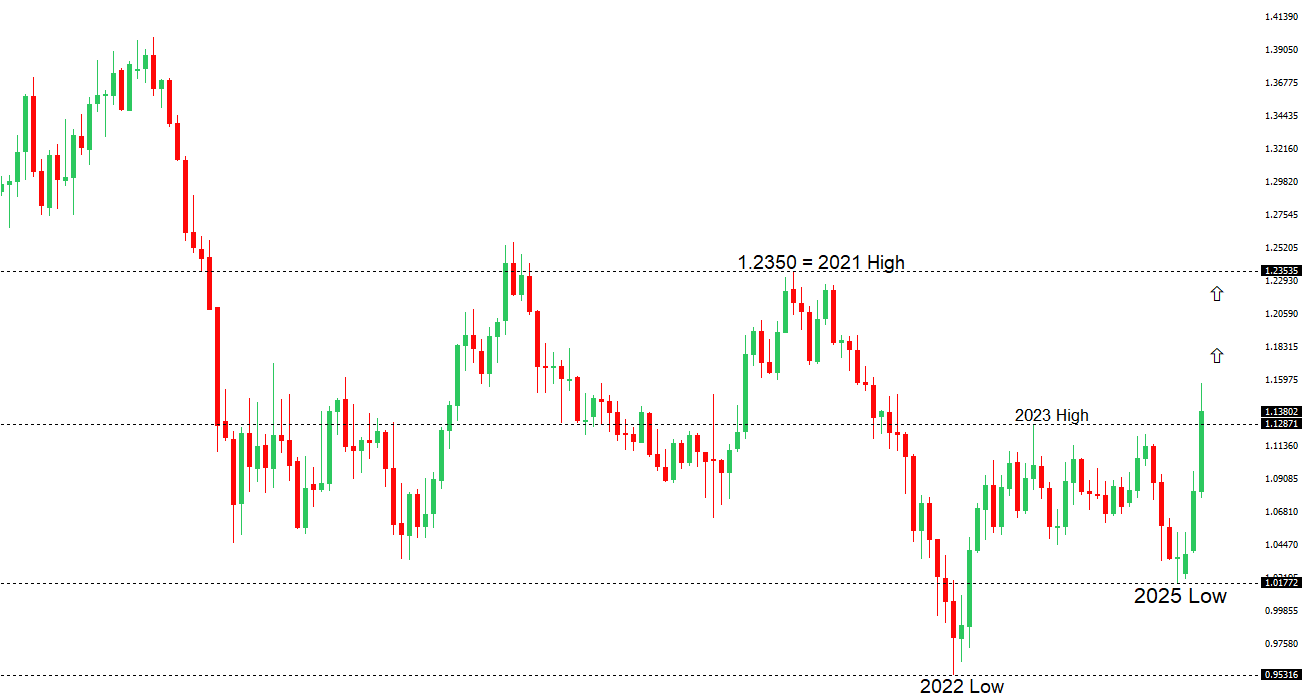 | ||
| R1 1.1574 - 21 April/2025 high - Strong R1 1.1426 - 28 April high - Medium S1 1.1266 - 1 May low - Medium S2 1.1148 - 3 April high - Strong | ||
| EURUSD: fundamental overview | ||
| The Eurozone’s April CPI data, due today, is expected to show a slight decline in overall inflation to 2.1% from 2.2%, driven by lower energy and service costs, while core inflation may rise slightly to 2.5% due to higher holiday-related expenses. Despite weak economic growth prompting the ECB to lower its 2025 GDP forecast to 0.9%, markets anticipate interest rate cuts starting in June, potentially lowering ECB deposit rates to 1.5%-1.75%. ECB officials emphasize a cautious, data-driven approach to policy decisions. Meanwhile, Eurozone pension funds with $770 billion in unhedged dollar exposure are shifting toward euro-based assets to hedge currency risks, and European consumers are increasingly favoring local products over U.S. alternatives due to trade tensions, signaling a potential long-term shift. | ||
| USDJPY: technical overview | ||
| There are signs of a meaningful top in place after the market put in a multi-year high in 2024. At this point, the door is now open for a deeper setback below the 2024 low at 139.58 over the coming sessions exposing a retest of the 2023 low. Rallies should be well capped below 150.00. | ||
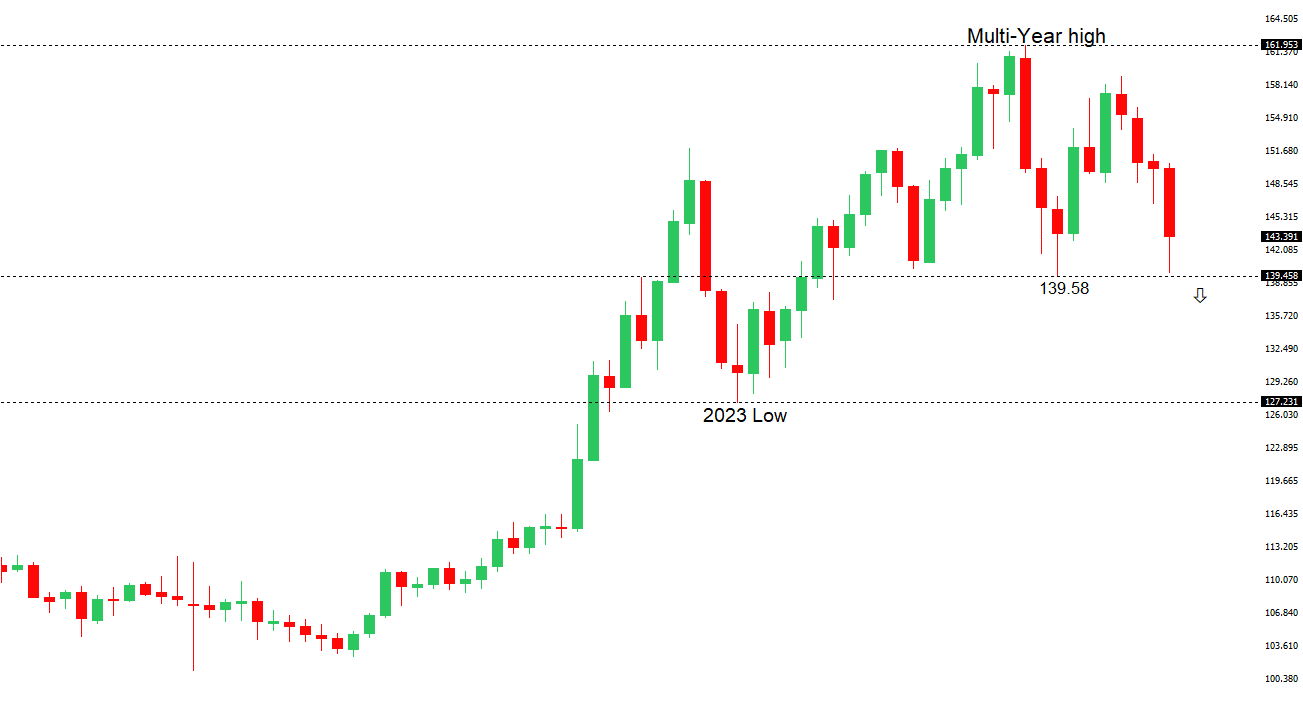 | ||
| R2 148.28 - 9 April high - Strong R1 145.93 - 2 May high - Medium S1 144.04 - 25 April high - Medium S1 141.97 - 29 April low - Medium | ||
| USDJPY: fundamental overview | ||
| The Bank of Japan has delayed its 2% inflation target and cut its growth forecast to 0.5% due to global trade uncertainties, reducing expectations for near-term rate hikes and boosting USDJPY. Despite this, BOJ Governor Ueda has emphasized rate hikes could resume if trade issues, particularly U.S. tariffs, are resolved, with Japan leveraging its U.S. treasury holdings in ongoing trade talks to secure favorable terms. Recent talks in Washington show progress, with hopes for a trade agreement by June, potentially shifting market focus back to BOJ rate hikes, with Bloomberg predicting a July increase and a target rate of 1.25% next year. Japan’s March data showed a slightly higher jobless rate of 2.5% but a tight labor market with a job-to-applicant ratio of 1.26, supporting wage growth and BOJ’s gradual rate hike plans. | ||
| AUDUSD: technical overview | ||
| There are signs of the potential formation of a longer-term base with the market trading down into a meaningful longer-term support zone. Only a monthly close below 0.5500 would give reason for rethink. A monthly close back above 0.7000 will take the big picture pressure off the downside and strengthen case for a bottom. | ||
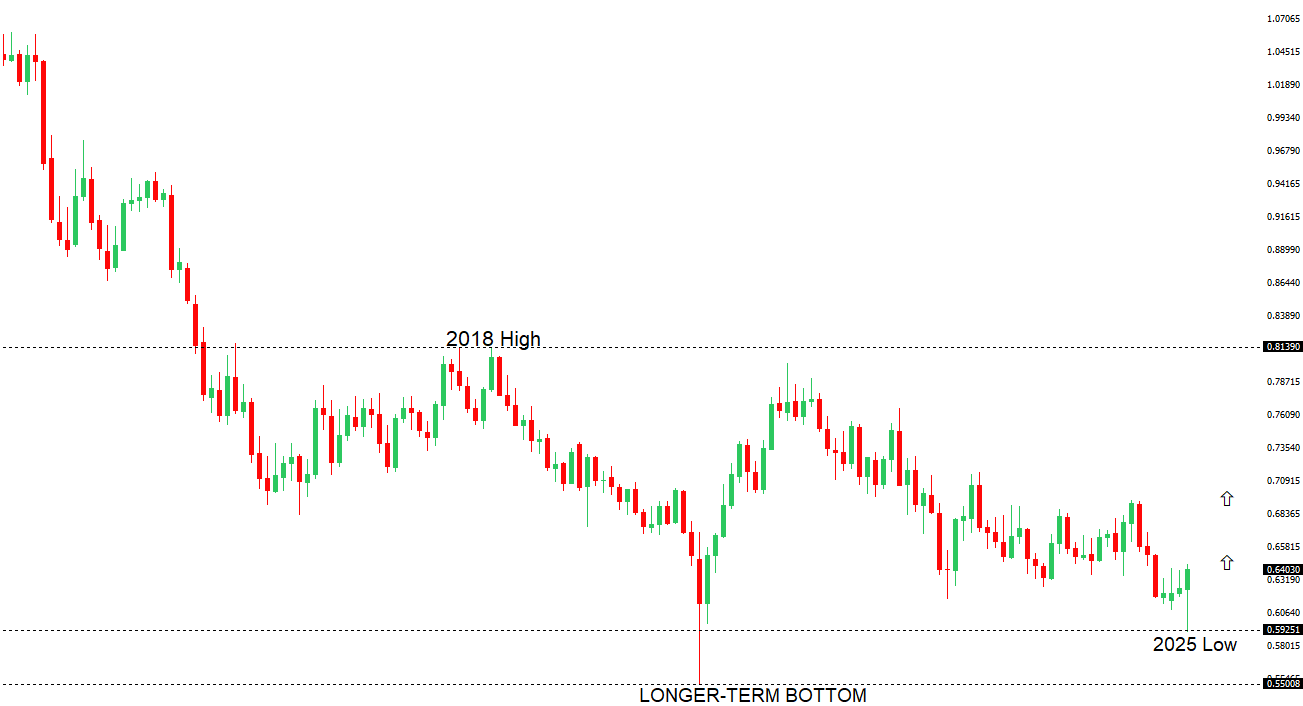 | ||
| R2 0.6500 - Psychological - Strong R1 0.6450 - 29 April/2025 high - Medium S1 0.6344 - 24 April low - Medium S1 0.6275 - 14 April low - Strong | ||
| AUDUSD: fundamental overview | ||
| The U.S. is nearing its first trade deals, but no official talks have occurred with China, who insists on tariff removal before negotiations, creating a standoff that could limit AUDUSD gains due to Australia’s trade ties with both nations. Weakening U.S. labor data may push the Federal Reserve toward rate cuts, with a 67% chance of a June cut and up to 100 basis points of easing by year-end, potentially weakening the dollar. In Australia, higher-than-expected March inflation and first-quarter PPI (0.9% QoQ, 3.7% YoY) suggest persistent price pressures, possibly leading the RBA to delay rate cuts despite market expectations of 115 basis points of easing in 2025. Australian retail sales rose 0.3% in March, slightly below forecasts but marking three months of growth. | ||
| Suggested reading | ||
| Six Ways the Federal Reserve Can Do a Better Job, B. Dudley, Bloomberg (May 1, 2025) AI’s Second Boom, L. Lango, Investor Place (April 30, 2025) | ||