


 | ||
| 5th May 2025 | view in browser | ||
| US tariffs and strong jobs data delay fed rate cuts | ||
| Over the weekend, Australian Prime Minister Albanese’s decisive election win bolstered political stability, potentially lifting the Australian Dollar to its fresh 2025 high. But overall, in Asia, markets were quiet due to Japan’s two-day holiday. | ||
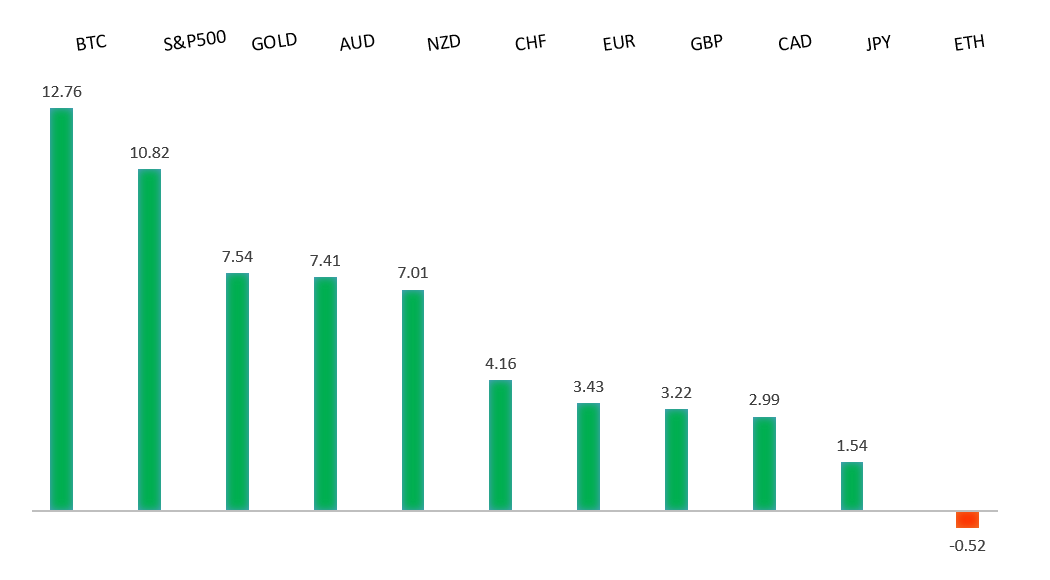
| Performance chart 30day v. USD (%) | ||
 | ||
| Technical & fundamental highlights | ||
| EURUSD: technical overview | ||
| Eurozone’s April flash CPI data showed inflation holding steady at 2.2% year-on-year, above the expected 2.1%, with core inflation rising to 2.7% due to higher airfares and holiday costs from Easter, though lower energy prices tempered the headline figure. Despite trade war pressures and a stronger euro, potential Chinese exports to the Eurozone may ease goods prices, supporting expectations for ECB rate cuts starting in June, possibly lowering deposit rates to 1.5%-1.75%. ECB officials stress a cautious, data-driven approach to policy decisions. Eurozone pension funds, with $770 billion in unhedged dollar exposure, are shifting to euro-based assets, limiting the EURUSD correction. Today’s May Sentix Investor Confidence index, following April’s sharp drop to -19.5, will be watched for signs of stabilization, while Germany’s upcoming factory orders and industrial production data will shed light on the manufacturing sector’s health amid U.S. tariffs. Banks like JPMorgan, Citigroup, and BNP Paribas now forecast EURUSD reaching $1.20 this year. | ||
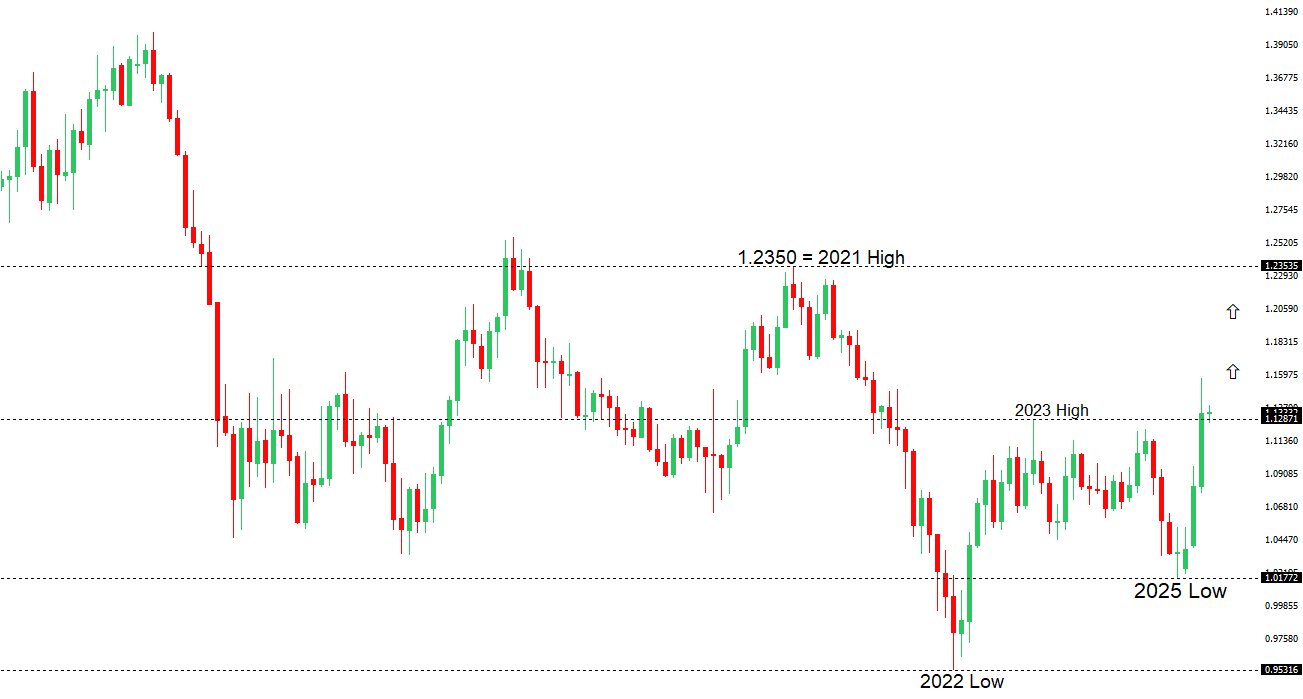 | ||
| R1 1.1574 - 21 April/2025 high - Strong R1 1.1426 - 28 April high - Medium S1 1.1266 - 1 May low - Medium S2 1.1148 - 3 April high - Strong | ||
| EURUSD: fundamental overview | ||
| The Eurozone’s April CPI data, due today, is expected to show a slight decline in overall inflation to 2.1% from 2.2%, driven by lower energy and service costs, while core inflation may rise slightly to 2.5% due to higher holiday-related expenses. Despite weak economic growth prompting the ECB to lower its 2025 GDP forecast to 0.9%, markets anticipate interest rate cuts starting in June, potentially lowering ECB deposit rates to 1.5%-1.75%. ECB officials emphasize a cautious, data-driven approach to policy decisions. Meanwhile, Eurozone pension funds with $770 billion in unhedged dollar exposure are shifting toward euro-based assets to hedge currency risks, and European consumers are increasingly favoring local products over U.S. alternatives due to trade tensions, signaling a potential long-term shift. | ||
| USDJPY: technical overview | ||
| There are signs of a meaningful top in place after the market put in a multi-year high in 2024. At this point, the door is now open for a deeper setback below the 2024 low at 139.58 over the coming sessions exposing a retest of the 2023 low. Rallies should be well capped below 150.00. | ||
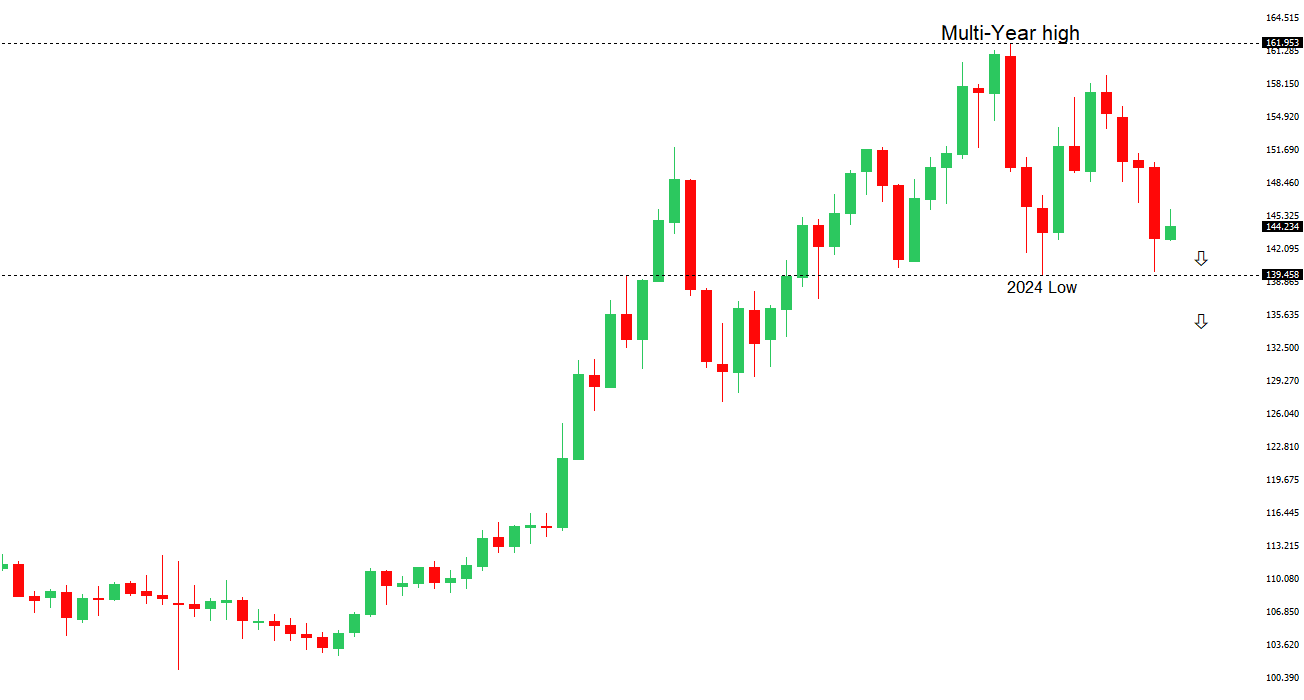 | ||
| R2 148.28 - 9 April high - Strong R1 145.93 - 2 May high - Medium S1 143.73 - 2 May low - Medium S1 141.97 - 29 April low - Medium | ||
| USDJPY: fundamental overview | ||
| Despite a strong U.S. April Non-Farm Payrolls report, USDJPY bulls struggled to gain momentum, as weak U.S. GDP (-0.3% in Q1) and contractionary ISM Manufacturing data (48.7) signal caution, with markets still expecting three Fed rate cuts this year but no change at the May 6-7 meeting. The Bank of Japan delayed its 2% inflation target and cut growth forecasts to 0.5% due to trade uncertainties, pushing back rate hike expectations, though Governor Ueda stressed hikes could resume if tariff issues clear, with Bloomberg predicting a July increase to a 1.25% target rate next year. Japan, leveraging its U.S. treasury holdings, is progressing in trade talks with the U.S., aiming for a June deal, which could shift focus back to BOJ rate hikes if auto and metal tariffs are resolved. Japan’s Finance Minister Kato downplayed using treasury holdings as leverage, but U.S. creditors hold significant negotiating power. This week, BOJ’s March meeting minutes and Japan’s March Household Spending data, both due Thursday, will be closely watched, with Japanese markets closed Monday and Tuesday for holidays. | ||
| AUDUSD: technical overview | ||
| There are signs of the potential formation of a longer-term base with the market trading down into a meaningful longer-term support zone. Only a monthly close below 0.5500 would give reason for rethink. A monthly close back above 0.7000 will take the big picture pressure off the downside and strengthen case for a bottom. | ||
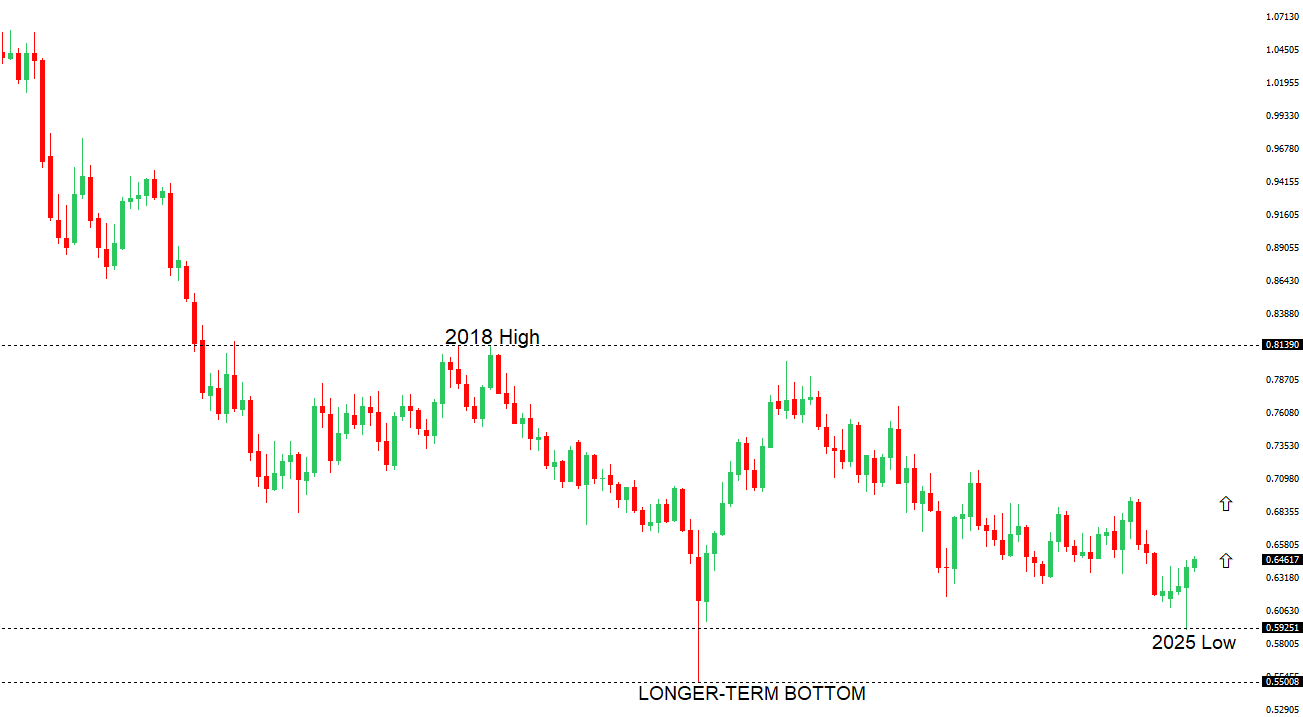 | ||
| R2 0.6500 - Psychological - Strong R1 0.6482 - 5 May/2025 high - Medium S1 0.6344 - 24 April low - Medium S1 0.6275 - 14 April low - Strong | ||
| AUDUSD: fundamental overview | ||
| Australian Prime Minister Albanese’s landslide election victory strengthens political stability, potentially boosting the Australian Dollar, while rising 10-year bond yields signal persistent budget deficits. Signs of easing U.S.-China trade tensions, with China considering tariff talks after U.S. outreach, could further support Aussie, given Australia’s trade ties with both nations. Strong U.S. April jobs data may be the last positive report for a while, as tariff impacts loom, potentially pushing the Fed toward rate cuts (80 basis points expected by year-end) to support employment despite above-target inflation. In Australia, March inflation (3.3% YoY, above the RBA’s 2-3% target) and rising consumer inflation expectations (4.2%) suggest persistent price pressures, casting doubt on market expectations of 103 basis points of RBA rate cuts in 2025, likely leading to a more cautious easing approach. | ||
| Suggested reading | ||
| Six Ways the Federal Reserve Can Do a Better Job, C. Smith, Of Two Minds (May 2, 2025) The Real Global Contest Is Over Capital, J. Zito, Apollo (April 30, 2025) | ||