


 | ||
| 7th November 2025 | view in browser | ||
| Yield differentials flip the script | ||
| The ongoing US government shutdown continues to block official jobs data, leaving markets focused on private signals: October’s Challenger report revealed 153,000 layoffs, nearly triple last year’s level and the highest for the month since 2003. | ||
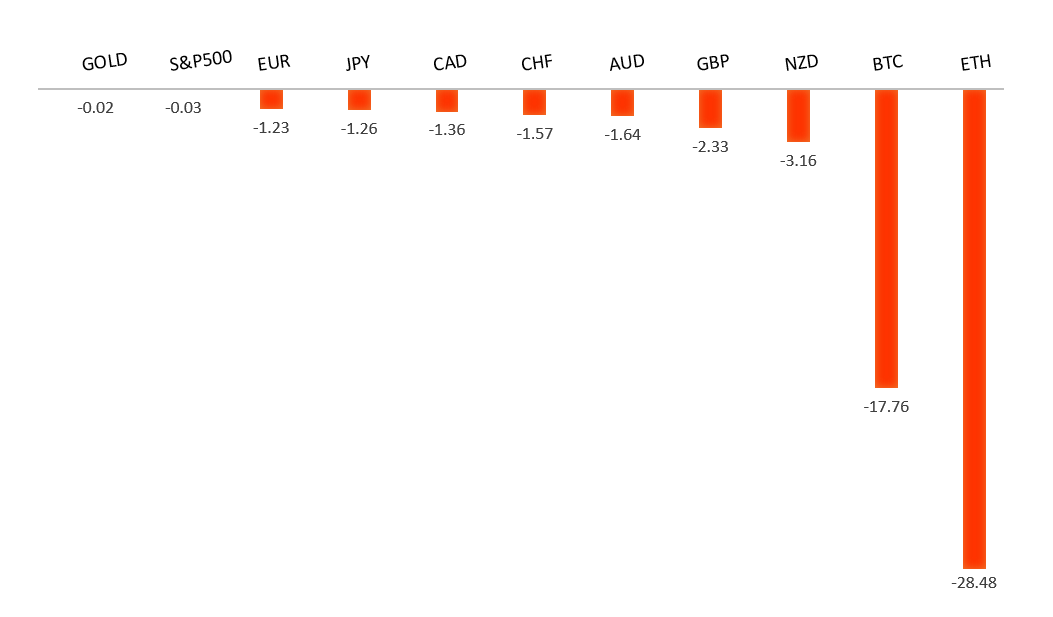
| Performance chart 30day v. USD (%) | ||
 | ||
| Technical & fundamental highlights | ||
| EURUSD: technical overview | ||
| The Euro outlook remains constructive with higher lows sought out on dips in favor of the next major upside extension targeting the 2021 high at 1.2350. Setbacks should be exceptionally well supported ahead of 1.1300. | ||
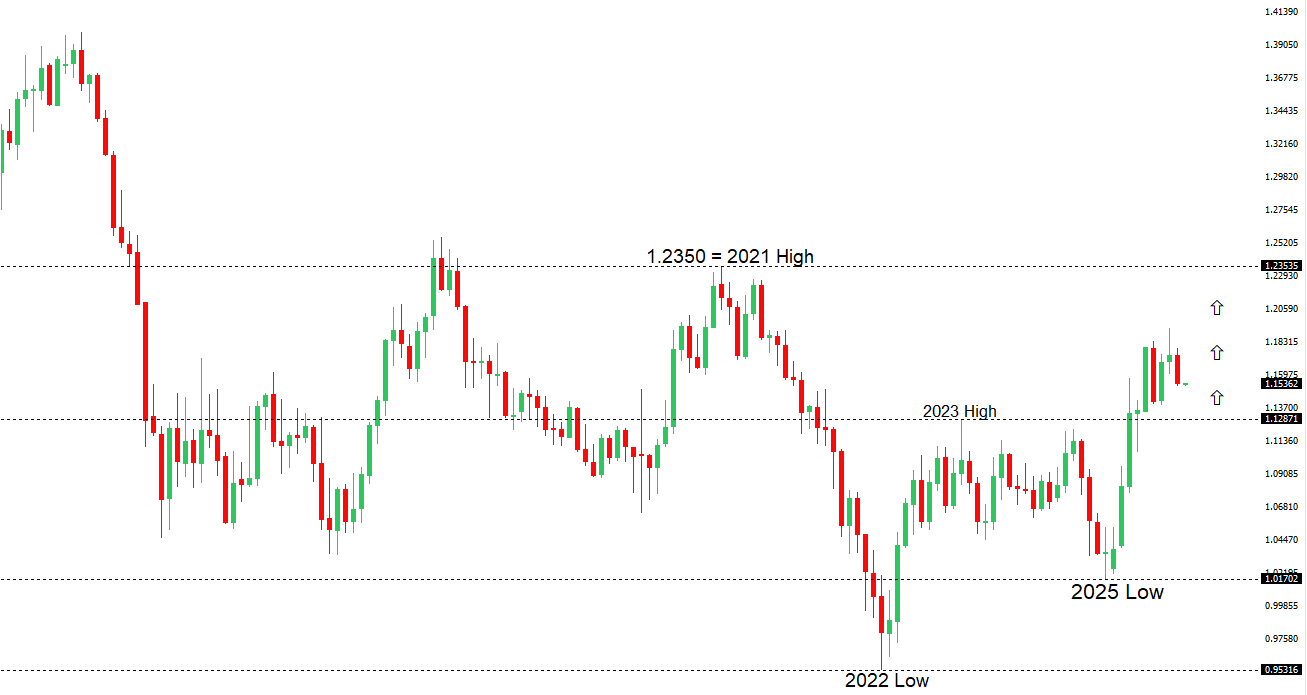 | ||
| R2 1.1729 - 17 October high -Strong R1 1.1669 - 28 October high - Medium S1 1.1469 - 5 November low - Medium S2 1.1392 - 1 August low - Strong | ||
| EURUSD: fundamental overview | ||
| Eurozone retail sales dipped 0.1% in September, matching August’s decline and missing forecasts for growth, though year-over-year sales rose just 1% amid improving consumer confidence. Germany’s industrial production rebounded 1.3% in September but remains down 1% annually, with analysts expecting only modest, cyclical gains ahead from rising orders, lower inventories, and planned infrastructure spending. ECB officials highlight balanced growth risks, moderating services inflation, and unexpected economic resilience, justifying steady rates at 2%; analysts see narrowing US-Europe growth gaps supporting the euro, with one major investment house forecasting $1.20 by Q4 2025 and $1.26 by Q3 2026 as the ECB pauses while the Fed eases. | ||
| USDJPY: technical overview | ||
| There are signs of a meaningful top in place after the market put in a multi-year high in 2024. At this point, the door is now open for a deeper setback below the 2024 low at 139.58, exposing a retest of the 2023 low. Rallies should be well capped below 155.00. | ||
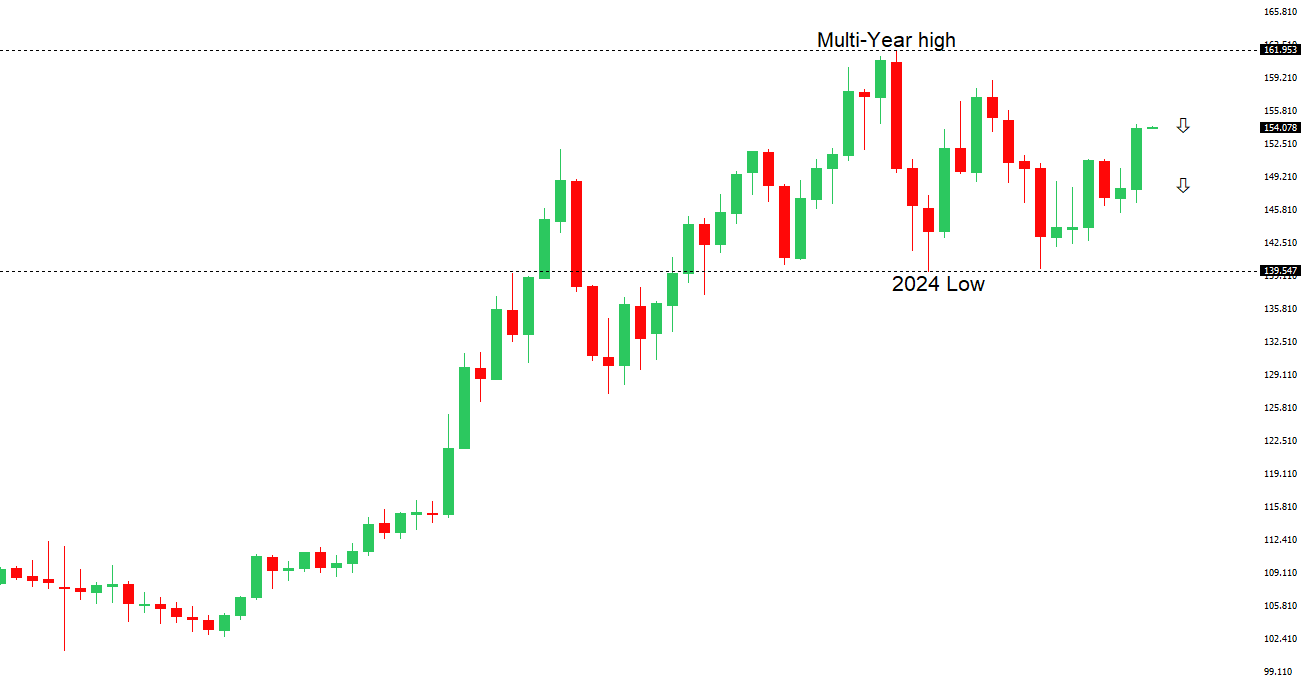 | ||
| R2 154.80 - 12 February high - Strong R1 154.48 - 4 November high - Medium S1 151.54 - 29 October low - Medium S2 149.38 - 17 October low - Strong | ||
| USDJPY: fundamental overview | ||
| The yen strengthened sharply during yesterday’s dollar sell-off amid a shift to risk-off sentiment, though it’s premature to label the November 4 high of 154.48 in USDJPY as the rally’s peak. Japan’s September wage data showed nominal growth of 1.9% YoY as expected, but the BOJ’s key scheduled full-time pay measure rose only 2.2% (below 2.5% forecast), while real earnings fell 1.4% for the ninth straight month, highlighting ongoing pressure on purchasing power and consumer demand. With Governor Ueda focused on next year’s wage talks, major unions like UA Zensen and Rengo are targeting 5-6% hikes in 2026, signaling potential support for sustainable inflation and a BOJ rate hike—though persistent negative real wages may temper expectations for aggressive tightening. Household spending rose 1.8% YoY in September (missing 2.5% forecast but marking five months of gains), underscoring resilient domestic demand that accounts for over half of GDP. Any lasting USDJPY decline may depend more on aggressive Fed rate cuts than a single BOJ hike. | ||
| AUDUSD: technical overview | ||
| There are signs of the potential formation of a longer-term base with the market trading down into a meaningful longer-term support zone. Only a monthly close below 0.5500 would give reason for rethink. A monthly close back above 0.7000 will take the big picture pressure off the downside and strengthen case for a bottom. | ||
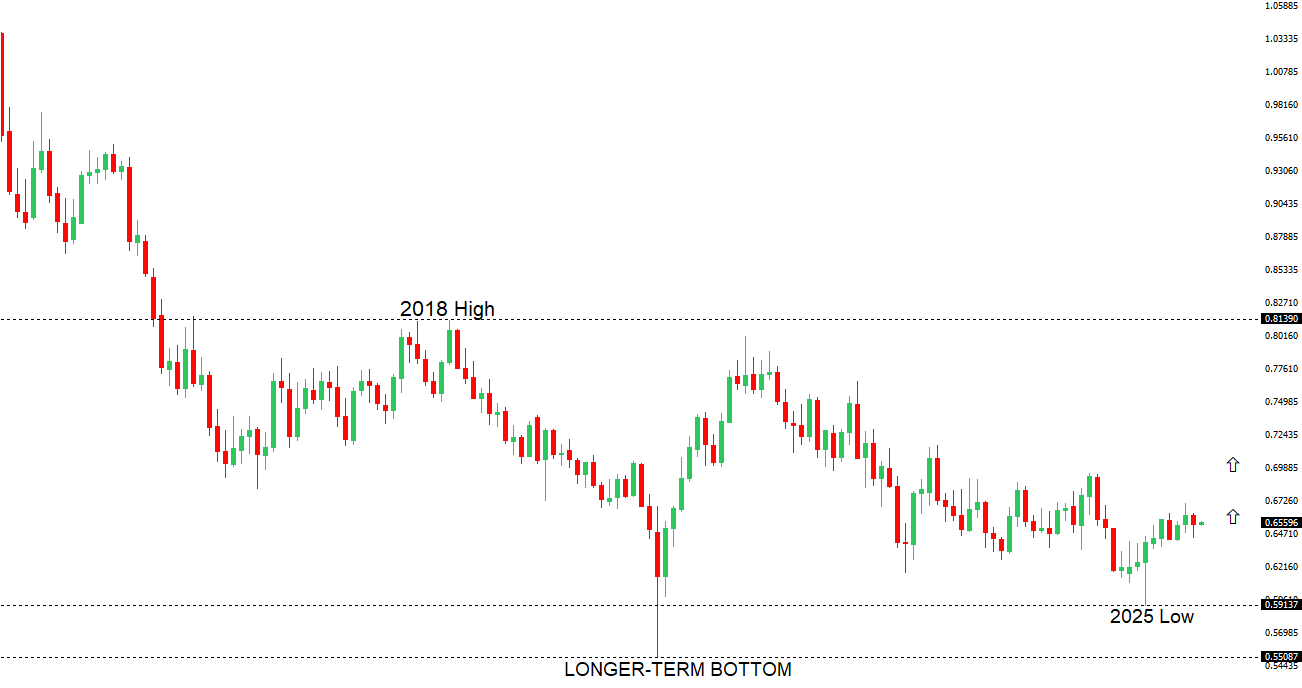 | ||
| R2 0.6629 - 1 October high - Strong R1 0.6618 - 29 October high - Medium S1 0.6458 - 5 November low - Medium S1 0.6440 - 14 October low - Strong | ||
| AUDUSD: fundamental overview | ||
| The RBA’s decision to hold rates at 3.6% and signal no further cuts until mid-2026 supports AUD appreciation into next year, with short-term dips likely holding above 0.6400. Near-neutral rates, rising core inflation above target, and Australia’s stronger GDP growth (1.8%-2.3% through 2027) versus the US (1.9%-2%) bolster domestic demand amid a stable job market. Improving China-US trade ties should lift China’s economy and global risk appetite, aiding the AUD despite a recent risk-off phase and October export dip, while reduced short positions, an 8% undervaluation per Bloomberg’s BEER model, and historical lows reinforce a bullish medium-term outlook unless risk aversion intensifies. | ||
| Suggested reading | ||
| The Consequences Of Axing Trump’s Tariffs, L. Baccardax, Barron’s (November 6, 2025) The Benefits of Bubbles, B. Thompson, Stratechery (November 5, 2025) | ||