


Today’s report: Global markets and end of week reflections
In our view, it’s hard to reconcile much of this week’s price action, especially the parts where risk assets were trying to rally. If we look at all the messages out there, with the exception of one, it would seem stocks should be lower and the US Dollar should be wanting to make a comeback.
Wake-up call
- Policy divergence
- Political drama
- safe haven
- strong data
- BoC hikes
- housing data
- Stocks vulnerable
- Dealers report
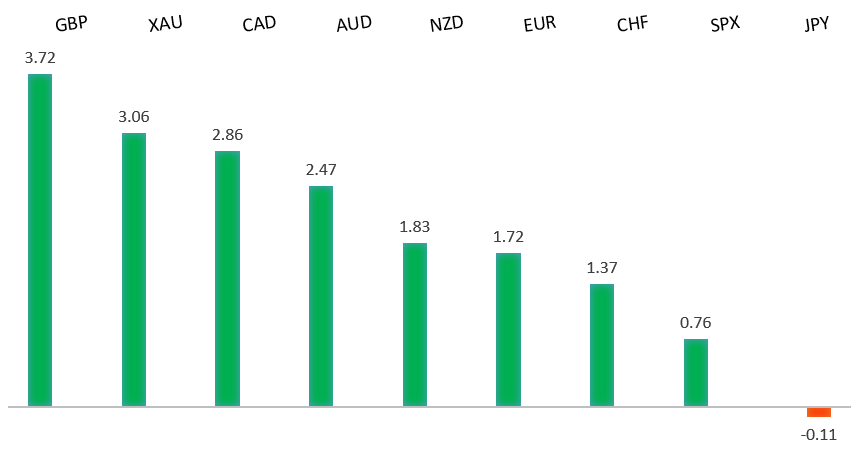
Peformance chart: 30 Day Performance vs. US dollar (%)
Suggested reading
- Will Sterling Markets See a Silver Lining If Boris Leaves?, M. Ashworth, Bloomberg (January 14, 2022)
- Why the Bitcoin Mining Boom Is Worth Watching, T. Regan, American Consequences (January 13, 2022)
Chart talk: Technical & fundamental highlights
Choose pair:
EURUSD – technical overview
Setbacks have extended to retest the critical 61.8% fib retrace off the 2020 low to 2021 high move. Technical studies are now turning up from extended territory on the weekly chart, warning of the need for an additional corrective bounce ahead. Look for the market to hold up on a weekly close basis above the 61.8% fib retrace around 1.1275. Weekly close back above 1.1500 strengthens outlook. Weekly close below 1.1275 negates.EURUSD – fundamental overview
The Euro has edged higher this week, mostly on broad US Dollar selling, though ultimately, Euro selling persists with the ECB stuck on the sidelines. Key standouts on today’s calendar come from UK GDP, industrial production, and construction output, Eurozone trade, and US reads highlighted by retail sales, industrial production, business inventories, and Michigan sentiment.EURUSD - Technical charts in detail
GBPUSD – technical overview
The market is in a correction phase in the aftermath of the run to fresh multi-month highs in 2021. At this stage, additional setbacks should be limited to the 1.3000 area ahead of the next major upside extension towards a retest and break of critical resistance in the form of the 2018 high. Back above 1.3835 takes pressure off the downside.GBPUSD – fundamental overview
The Pound continues to extend its run on broad US Dollar weakness and on UK fundamentals as well. The market is pricing a more aggressive BOE, and this has been helped along by reports that the virus impacting UK GDP only modestly. Many believe the UK is approaching herd immunity as well. Some also attribute gains to the political drama, with the thought that a Johnson exit would be GBP positive. Key standouts on today’s calendar come from UK GDP, industrial production, and construction output, Eurozone trade, and US reads highlighted by retail sales, industrial production, business inventories, and Michigan sentiment.USDJPY – technical overview
The longer-term trend is bearish despite the recent run higher. Look for additional upside to be limited, with scope for a topside failure and bearish resumption back down towards the 100.00 area. It would take a clear break back above 116.00 to negate the outlook.USDJPY – fundamental overview
The Yen has been well offered into 2022 on flow from US Dollar demand from diverging Fed/BOJ policy. But the recent round of intense risk off flow in US equities and a BOJ upgrade to the economic outlook have opened renewed demand for the Yen. Key standouts on today’s calendar come from UK GDP, industrial production, and construction output, Eurozone trade, and US reads highlighted by retail sales, industrial production, business inventories, and Michigan sentiment.AUDUSD – technical overview
The Australian Dollar has been in the process of a healthy correction following the impressive run towards a retest of the 2018 high in 2021. At this stage, the correction is starting to look stretched and setbacks should be well supported above 0.7000 on a weekly close basis. A weekly close below 0.7000 will force a bearish shift.AUDUSD – fundamental overview
We've seen some demand this week as stocks attempt to recover, Aussie data comes in strong and commodities prices jump. Key standouts on today’s calendar come from UK GDP, industrial production, and construction output, Eurozone trade, and US reads highlighted by retail sales, industrial production, business inventories, and Michigan sentiment.USDCAD – technical overview
Finally signs of a major bottom in the works after a severe decline from the 2020 high. A recent weekly close back above 1.2500 encourages the constructive outlook and opens the door for a push back towards next critical resistance in the 1.3000 area. Any setbacks should be well supported into the 1.2200s.USDCAD – fundamental overview
Oil has made an impressive run higher and the market has decided to go ahead and price 5 BoC rate hikes in 2022. Key standouts on today’s calendar come from UK GDP, industrial production, and construction output, Eurozone trade, and US reads highlighted by retail sales, industrial production, business inventories, and Michigan sentiment.NZDUSD – technical overview
The market has entered a period of intense correction after running up to a yearly and multi-month high. Back below 0.6700 would suggest a more significant bearish structural shift.NZDUSD – fundamental overview
Overall, economic data out of New Zealand has been softer of late, RBNZ rate hike expectations have been scaled back, the phased border reopening has been delayed due to omicron, and risk off flow has soured sentiment. All of this has been behind this latest wave of Kiwi underperformance into 2022. We have however seen some mild demand on account of broad based US Dollar selling and stronger Kiwi housing data. Key standouts on today’s calendar come from UK GDP, industrial production, and construction output, Eurozone trade, and US reads highlighted by retail sales, industrial production, business inventories, and Michigan sentiment.US SPX 500 – technical overview
Longer-term technical studies are looking quite exhausted and the market is showing signs of wanting to roll over after racing to another record high. At the same time, the latest breakout into the 4800 area introduces the possibility for the next major upside extension towards 5000. At this stage, it will take a break back below 4500 to take the immediate pressure off the topside.US SPX 500 – fundamental overview
We're trading just off fresh record highs, and yet, with so little room for additional central bank accommodation, given an already depressed interest rate environment, the prospect for sustainable runs to the topside on easy money policy incentives and government stimulus, should no longer be as enticing to investors. Meanwhile, ongoing worry associated with coronavirus fallout and risk of rising inflation should weigh more heavily on investor sentiment in Q1 2022.GOLD (SPOT) – technical overview
The 2019 breakout above the 2016 high at 1375 was a significant development, opening the door for fresh record highs and an acceleration beyond the next major psychological barrier at 2000. Setbacks should now be well supported above 1600.GOLD (SPOT) – fundamental overview
The yellow metal continues to be well supported on dips with solid demand from medium and longer-term accounts. These players are more concerned about exhausted monetary policy, extended global equities, and coronavirus fallout. All of this should keep the commodity well supported, with many market participants also fleeing to the hard asset as the grand dichotomy of record high equities and record low yields comes to an unnerving climax.