


Special report: BOE policy decision preview
Today’s report: Investors unsettled by that dot plot
The market was dealt another blow on Wednesday, in large part because of yet another hawkish decision. There wasn’t anything all that surprising, but it seems investors continue to be unsettled by a dot plot that keeps on pointing to higher rates looking out.
Wake-up call
- Russia news
- BOE decision
- Yamasaki
- RBA Bullock
- diverging outlooks
- macro flow
- Inflation headache
- Dealers report
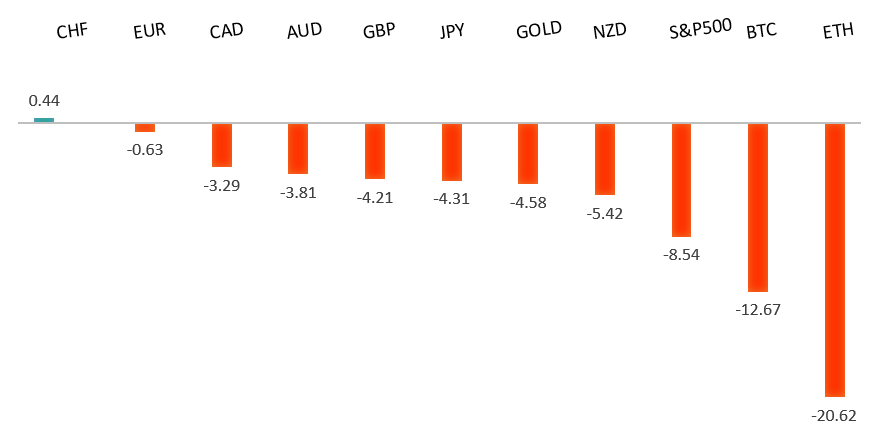
Peformance chart: 30 Day Performance vs. US dollar (%)
Suggested reading
- Is China Done With Its Market Crackdown? Ask Fosun, S. Ren, Bloomberg (September 22, 2022)
- Will Tesla's Optimus robot become a reality?, T. Hannen, Financial Times (September 22, 2022)
Chart talk: Technical & fundamental highlights
Choose pair:
EURUSD – technical overview
The market has come under intense pressure in recent months, with setbacks accelerating below the critical multi-year low from 2017 at 1.0340. This has set up a dip below monumental support in the form of parity. At the same time, technical studies are tracking in oversold territory, suggesting additional setbacks should be limited. Back above 1.0370 would be required to take the immediate pressure off the downside.EURUSD – fundamental overview
The Euro extended its run to a fresh near 20 year low on the combination of the news of Russian President Putin announcing a mobilization of forces and on a hawkish Fed decision. Meanwhile, ECB Guindos hasn't helped matters after delivering a downbeat economic assessment. Key standouts on Thursday’s calendar come from the BOE policy decision and US initial jobless claims.EURUSD - Technical charts in detail
GBPUSD – technical overview
The downtrend has been intense, with the market collapsing to a fresh multi-year low below what had been formidable support in the 1.1400 area. The next major barrier below comes in at 1.1000, though technical studies are severely extended, begging for some form of meaningful correction back to the topside. Back above 1.1739 takes the immediate pressure off the downside.GBPUSD – fundamental overview
The Pound has continued with its collapse, now down to a 37.5 year low. The energy crisis, concerning UK economic data, and a hawkish Fed decision have all factored into the price action. Key standouts on Thursday’s calendar come from the BOE policy decision and US initial jobless claims.USDJPY – technical overview
Technical studies are looking quite stretched on the longer-term chart, warning of consolidation and correction in the days and weeks ahead. Look for additional upside from here to be well capped into the 145.00 area. Next key support comes in at 140.25.USDJPY – fundamental overview
The massive monetary policy divergence between the Fed and BOJ continues to drive the direction in this market. At the same time, there has been more talk around intervention, including Former Vice Finance Minister Yamasaki advising that Japan is now ready to intervene in the FX markets at any moment, if needed, and that the country doesn't need to wait for a green light from the US. Key standouts on Thursday’s calendar come from the BOE policy decision and US initial jobless claims.AUDUSD – technical overview
Overall pressure remains on the downside with the market confined to a well defined downtrend. A break back above 0.7137 would be required to take the pressure off the downside. Until then, scope exists for deeper setbacks towards 0.6500.AUDUSD – fundamental overview
Risk off flow has been hurting the Australian Dollar, while this latest less hawkish talk out from RBA isn't doing much to help Aussie either. Most recently, we've heard from RBA Deputy Governor Bullock who said she wasn't sure if rates were in restrictive territory. Meanwhile, the Fed just delivered another hawkish decision, which has fueled this latest wave of declines to fresh yearly lows. Today’s calendar is highlighted by the FOMC rate decision. Key standouts on Thursday’s calendar come from the BOE policy decision and US initial jobless claims.USDCAD – technical overview
A recent surge back above 1.3000 signals an end to a period of bearish consolidation and suggests the market is in the process of carving out a more significant longer-term base. Next key resistance now comes in up into the 1.4000 area. Setbacks should be very well supported down into the 1.3000 area.USDCAD – fundamental overview
Canada economic data has been quite soft of late including the latest Canada CPI miss. Meanwhile, we have yield differentials continuing to lean in the US Dollar's favor and a risk off mood, all factoring into this drop in the Canadian Dollar to fresh yearly and multi-month lows. The hawkish Fed decision has only accelerated Canadian Dollar declines. Key standouts on Thursday’s calendar come from the BOE policy decision and US initial jobless claims.NZDUSD – technical overview
Overall pressure remains on the downside despite the recent recovery and conditions remain quite choppy. A break back above 0.6251 would be required to take the pressure off the downside. Until then, scope exists for deeper setbacks towards 0.5500.NZDUSD – fundamental overview
The risk correlated New Zealand Dollar has extended its run of multi-month lows, this on the back of the latest downturn in global sentiment in the aftermath of this latest hawkish Fed decision. Key standouts on Thursday’s calendar come from the BOE policy decision and US initial jobless claims.US SPX 500 – technical overview
Longer-term technical studies are in the process of unwinding from extended readings off record highs. Look for rallies to be well capped in favor of lower tops and lower lows. Back above 4,328 will be required at a minimum to take the immediate pressure off the downside. Next major support comes in around 3,400.US SPX 500 – fundamental overview
We've finally reached a point in the cycle where the Fed recognizes unanchored inflation expectations pose a greater downside risk than over-tightening. This is significant, as it means less investor friendly monetary policy that risks potential recession in the months ahead. We have seen an attempt at recovery in recent weeks, with softer CPI reads helping. But overall, we expect inflation to continue to be a problem that results in renewed downside pressure into rallies.GOLD (SPOT) – technical overview
The 2019 breakout above the 2016 high at 1375 was a significant development, opening the door for fresh record highs. Setbacks should now be well supported above 1600 on a monthly close basis.GOLD (SPOT) – fundamental overview
The yellow metal continues to be well supported on dips with solid demand from medium and longer-term accounts. These players are more concerned about inflation risk and a less upbeat global growth outlook. All of this should keep the commodity well supported, with many market participants also fleeing to the hard asset as the grand dichotomy of record high equities and record low yields comes to an unnerving climax.