


Today’s report: A disruptive disconnect
It’s been a tough week in financial markets. Investors have been forced to come to terms with this new reality of higher for longer interest rates in the US, with rates now seen above 4.3% for the entirety of 2023.
Wake-up call
- consumer sentiment
- lighter hike
- BOJ intervenes
- iron ore
- diverging outlooks
- trade deficit
- Inflation headache
- Dealers report
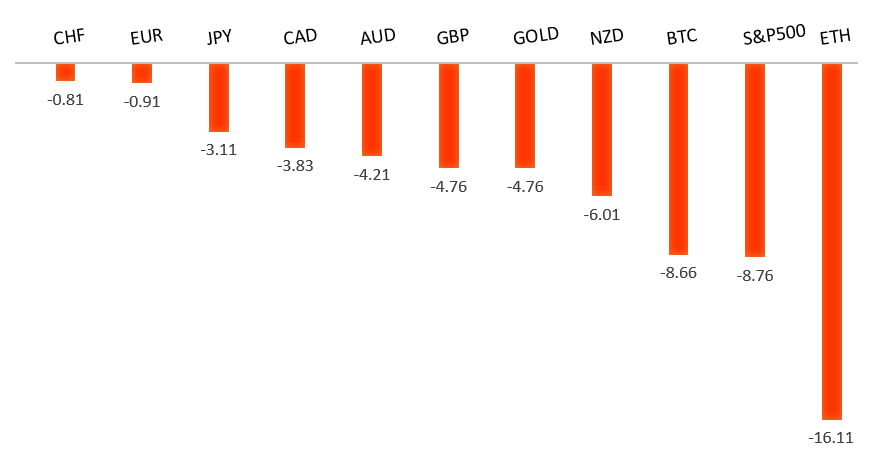
Peformance chart: 30 Day Performance vs. US dollar (%)
Suggested reading
- What Comes After a Week That Shook the World, J. Authers, Bloomberg (September 23, 2022)
- Will Tesla's Optimus robot become a reality?, T. Hannen, Financial Times (September 22, 2022)
Chart talk: Technical & fundamental highlights
Choose pair:
EURUSD – technical overview
The market has come under intense pressure in recent months, with setbacks accelerating below the critical multi-year low from 2017 at 1.0340. This has set up a dip below monumental support in the form of parity. At the same time, technical studies are tracking in oversold territory, suggesting additional setbacks should be limited. Back above 1.0370 would be required to take the immediate pressure off the downside.EURUSD – fundamental overview
The Euro remains weighed down into Friday after Eurozone consumer sentiment hit a record low. Key standouts on today’s calendar come from German, Eurozone, and UK PMI reads, UK CBI trades, Canada retail sales, US PMI reads, and a Fed Powell speech.EURUSD - Technical charts in detail
GBPUSD – technical overview
The downtrend has been intense, with the market collapsing to a fresh multi-year low below what had been formidable support in the 1.1400 area. The next major barrier below comes in at 1.1000, though technical studies are severely extended, begging for some form of meaningful correction back to the topside. Back above 1.1739 takes the immediate pressure off the downside.GBPUSD – fundamental overview
The Pound has continued to struggle in the aftermath of a controversial BOE decision in which the central bank opted to only go for a 50 basis point rate hike. Three members wanted to see 75 basis points but ultimately got outvoted. Key standouts on today’s calendar come from German, Eurozone, and UK PMI reads, UK CBI trades, Canada retail sales, US PMI reads, and a Fed Powell speech.USDJPY – technical overview
Technical studies are looking quite stretched on the longer-term chart, warning of consolidation and correction in the days and weeks ahead. Look for additional upside from here to be well capped into the 145.00 area. Next key support comes in at 140.25.USDJPY – fundamental overview
The Yen rallied back in a big way on Thursday, this after the BOJ finally stepped in with its first intervention since 1998. Meanwhile, the BOJ is the last negative rate regime, after keeping rates unchanged at -0.10%. Japan also announced that it would restore pre-Covid travel rules from October 11. Key standouts on today’s calendar come from German, Eurozone, and UK PMI reads, UK CBI trades, Canada retail sales, US PMI reads, and a Fed Powell speech.AUDUSD – technical overview
Overall pressure remains on the downside with the market confined to a well defined downtrend. A break back above 0.7137 would be required to take the pressure off the downside. Until then, scope exists for deeper setbacks towards 0.6500.AUDUSD – fundamental overview
The Australian Dollar has done a good job shrugging off this latest bout of risk off flow, getting help from solidly bid commodities prices, highlighted by a run up in iron ore. And earlier today, Aussie PMI data managed to tick up from previous prints. Today’s calendar is highlighted by the FOMC rate decision. Key standouts on today’s calendar come from German, Eurozone, and UK PMI reads, UK CBI trades, Canada retail sales, US PMI reads, and a Fed Powell speech.USDCAD – technical overview
A recent surge back above 1.3000 signals an end to a period of bearish consolidation and suggests the market is in the process of carving out a more significant longer-term base. Next key resistance now comes in up into the 1.4000 area. Setbacks should be very well supported down into the 1.3000 area.USDCAD – fundamental overview
Canada economic data has been quite soft of late including the latest Canada CPI miss. Meanwhile, we have yield differentials continuing to lean in the US Dollar's favor and a risk off mood, all factoring into this drop in the Canadian Dollar to fresh yearly and multi-month lows. The hawkish Fed decision has only accelerated Canadian Dollar declines this week. Key standouts on today’s calendar come from German, Eurozone, and UK PMI reads, UK CBI trades, Canada retail sales, US PMI reads, and a Fed Powell speech.NZDUSD – technical overview
Overall pressure remains on the downside despite the recent recovery and conditions remain quite choppy. A break back above 0.6251 would be required to take the pressure off the downside. Until then, scope exists for deeper setbacks towards 0.5500.NZDUSD – fundamental overview
The risk correlated New Zealand Dollar has extended its run of multi-month lows, this on the back of the latest downturn in global sentiment in the aftermath of this latest hawkish Fed decision. We've also seen the Kiwi rate dragged down by the wider New Zealand trade deficit. Key standouts on today’s calendar come from German, Eurozone, and UK PMI reads, UK CBI trades, Canada retail sales, US PMI reads, and a Fed Powell speech.US SPX 500 – technical overview
Longer-term technical studies are in the process of unwinding from extended readings off record highs. Look for rallies to be well capped in favor of lower tops and lower lows. Back above 4,328 will be required at a minimum to take the immediate pressure off the downside. Next major support comes in around 3,400.US SPX 500 – fundamental overview
We've finally reached a point in the cycle where the Fed recognizes unanchored inflation expectations pose a greater downside risk than over-tightening. This is significant, as it means less investor friendly monetary policy that risks potential recession in the months ahead. We have seen an attempt at recovery in recent weeks, with softer CPI reads helping. But overall, we expect inflation to continue to be a problem that results in renewed downside pressure into rallies.GOLD (SPOT) – technical overview
The 2019 breakout above the 2016 high at 1375 was a significant development, opening the door for fresh record highs. Setbacks should now be well supported above 1600 on a monthly close basis.GOLD (SPOT) – fundamental overview
The yellow metal continues to be well supported on dips with solid demand from medium and longer-term accounts. These players are more concerned about inflation risk and a less upbeat global growth outlook. All of this should keep the commodity well supported, with many market participants also fleeing to the hard asset as the grand dichotomy of record high equities and record low yields comes to an unnerving climax.